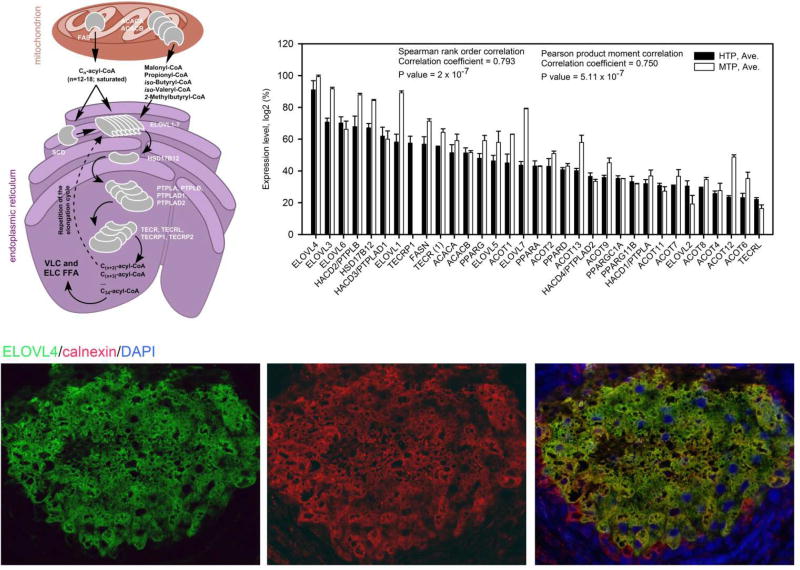
Figure 6.
Elongation of fatty acids in Meibomian glands of humans and mice.
Upper left panel. Proposed sequence of FA elongation steps occurring in mitochondria and endoplasmic reticulum of meibocytes.
Upper right panel. Expression patterns of major fatty acid elongation genes in tarsal plates of humans (4 donors, one sample of tarsal plate from each) and mice (12 mice; two pooled samples, 6 mice × 4 tarsal plates each) (Butovich et al., unpublished). Expression levels (Log2 values of SST-RMA-Gene-Full-Signals, varying from ~20 to ~2) were calculated using the Expression Console (built 1.4.1.46) from Affymetrix, then ranked from high to low, normalized from 100% (the highest expression level) to about 10% (the lowest expression level which was considered to be just above the noise level), and plotted as shown in the Panel (Butovich et al., 2016).
Bottom panels. Immunohistochemical anti-ELOVL4 (green)/anti-calnexin (red)/DAPI (blue) co-staining of meibocytes in the human tarsal plates acini [from (Butovich et al., 2016)].

