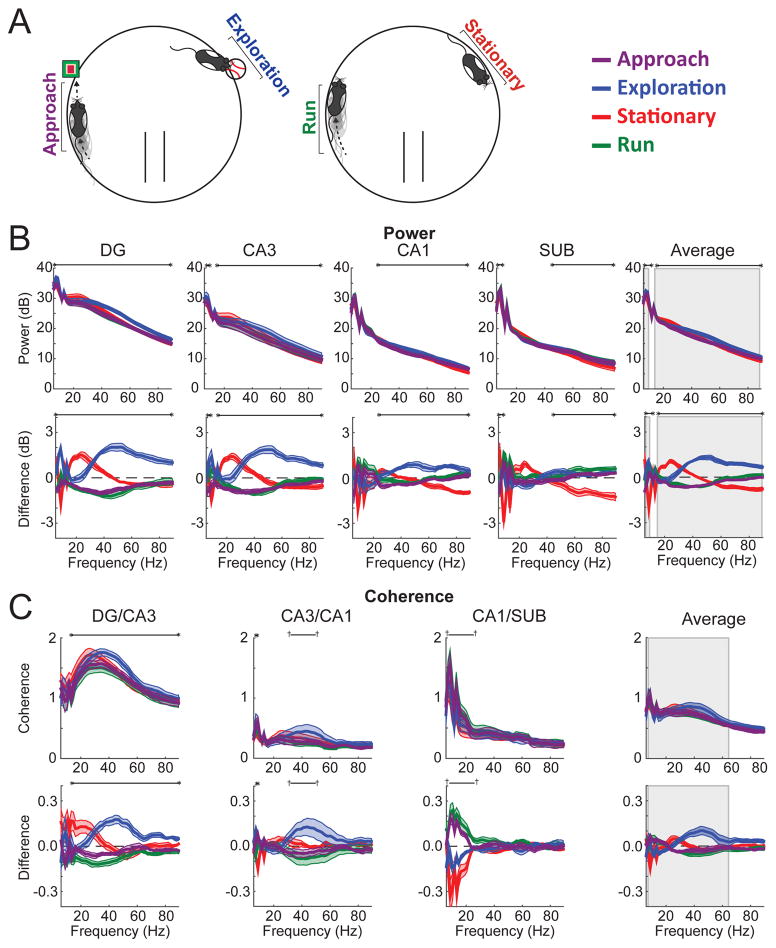
Figure 2. Object exploration was accompanied by a distinct spectral profile.
(A) Illustration of the four behavioral states analyzed. (B) Top: Spectral power for each hippocampal subregion (and averaged across subregions) for each behavioral state. Bottom: Spectral power plotted as the difference from average across behavioral states. (C) Top: Coherence for each directly connected pair of hippocampal subregions (and averaged across subregion pairs). Bottom: Coherence plotted as the difference from average across behavioral states. Throughout the figure, gray rectangles mark frequency ranges exhibiting significant interactions between behavioral state and subregion. Black horizontal lines bookended by dagger symbols (†) indicate frequency ranges differing significantly (p<.05) across behavioral states, and those bookended by asterisks indicate significant differences after Bonferroni correction for multiple comparisons (here, 5 for power and 4 for coherence). Colored lines indicate mean (darker shading) ± SEM (lighter shading). See also Figures S1, S2, and S3.

