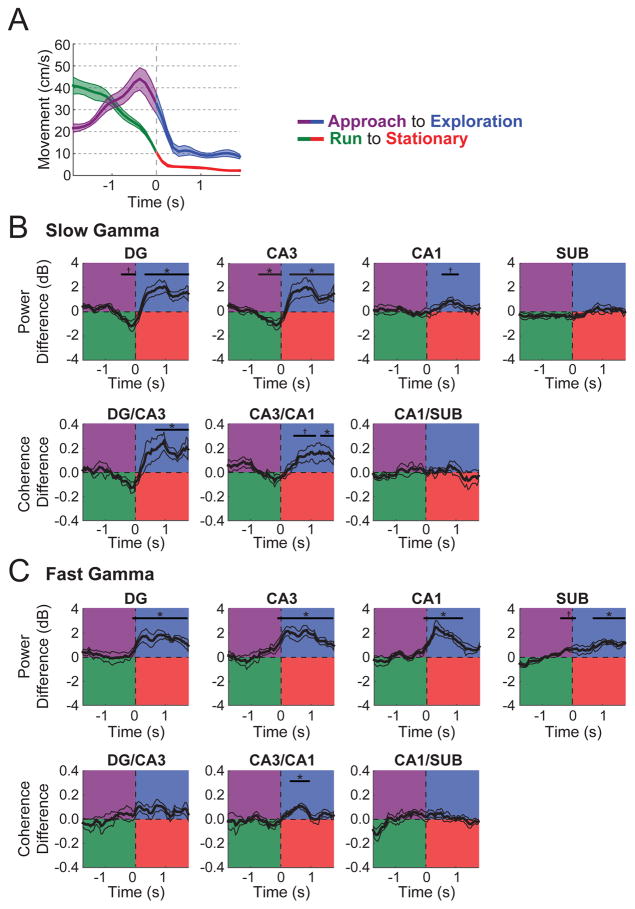
Figure 3. Gamma power and coherence during exploration was not explained as the product of the cessation of locomotion.
(A) Speed of movement for 4-s epochs surrounding the transition from novel object Approach to Exploration (purple to blue) and from Run to Stationary (green to red). (B) Slow gamma power (top) and coherence (bottom) plotted as the difference between behavioral state transitions (Approach to Exploration minus Run to Stationary). For example, for CA3 slow gamma power, power was reduced for Approach relative to Run but increased during Exploration relative to Stationary. (C) Fast gamma power (top) and coherence (bottom) plotted as the difference between behavioral state transitions (Approach to Exploration minus Run to Stationary). Indicators of statistical significance throughout are the same as in Figure 2 except that Bonferroni-correction involved four and three comparisons here for power and coherence, respectively. Colored lines indicate mean (darker shading) ± SEM (lighter shading). See also Tables S1 and S2.

