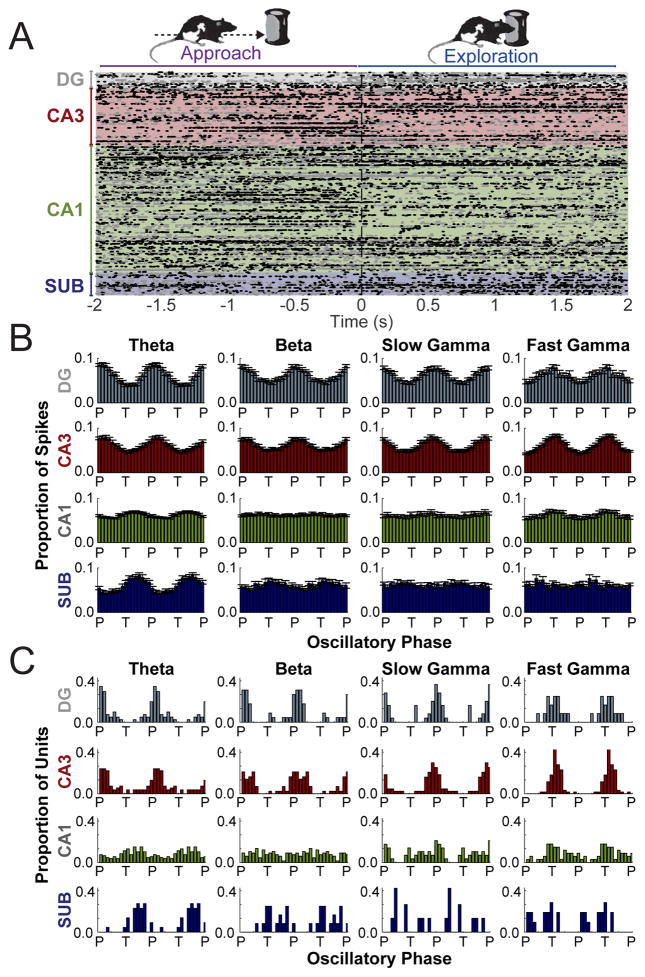
Figure 4. Principal cell firing aligned strongly to local oscillations in distinct frequency bands.
(A) Peri-event raster of spike times by subregion time-locked to the initiation of object exploration events (0 s) [Approach (< 0 s); Exploration (> 0 s)]. Each dot indicates an action potential. Each row shows all action potentials from a single neuron. Rows alternate between gray and black dots for better visibility. (B) Mean distributions of action potentials in each subregion relative to the phase (P = peak; F = falling; T = trough; R = rising) of distinct oscillatory rhythms (denoted at top) recorded from that same subregion. Averages and error (SEM) are for those neurons found to be significantly phase modulated (see text). (C) Distributions across significantly phase modulated neurons of mean preferred oscillatory phase for spiking. Data is plotted twice in panels B and C, replicated across the oscillatory cycle, to aid visualization of periodicity. See also Figures S3, S4, and S5 and Table S3.

