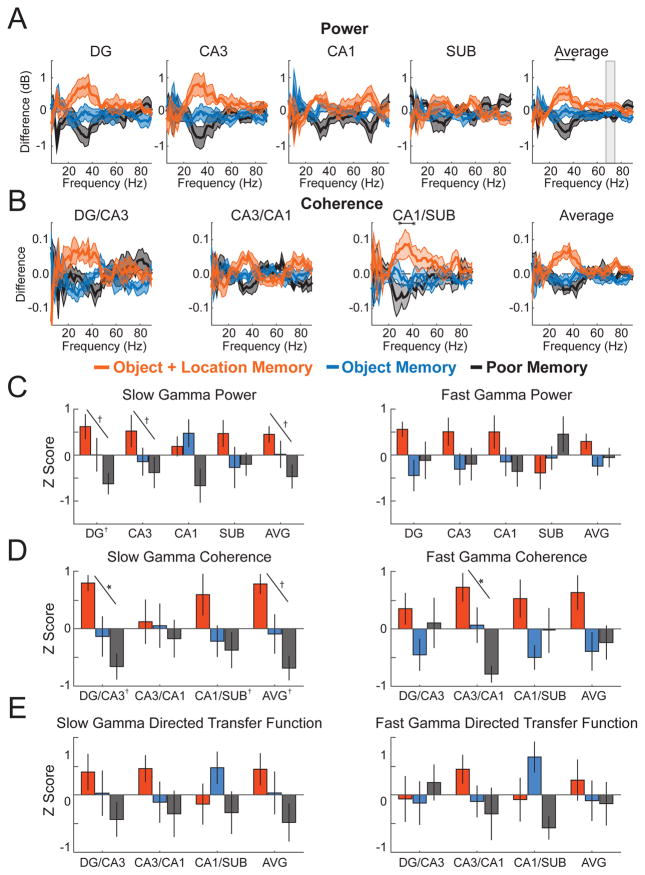
Figure 7. Slow gamma during novel object exploration related to subsequent object-location associative memory.
(A) Power by subregion (and the average across subregions) plotted as the difference from mean across memory conditions (denoted throughout figure by colors indicated in legend). (B) Coherence for each directly connected subregion pair plotted as the difference from mean across conditions. (C) Average slow gamma and fast gamma power for each subregion (and averaged across subregions; AVG) standardized to the mean across conditions and plotted as Z score. (D) Average slow gamma and fast gamma coherence for each directly connected subregion pair (and averaged across subregion pairs; AVG) standardized to the mean across conditions and plotted as Z score. (E) Average slow gamma and fast gamma non-normalized directed transfer function standardized to the mean across conditions and plotted as Z score. Colored lines in panels A and B indicate mean (darker shading) ± SEM (lighter shading). Error bars in panels C, D, and E show SEM. Indicators of statistical significance in panels A and B are the same as in Figure 2. Similarly, diagonal lines in panels C, D, and E indicate statistical significance of linear trends, and symbols next the region labels on the x axes indicate statistical significance for that region of one-way repeated measures ANOVAs across object conditions. See also Figure S7 and Tables S6 and S7 for detailed statistics.

