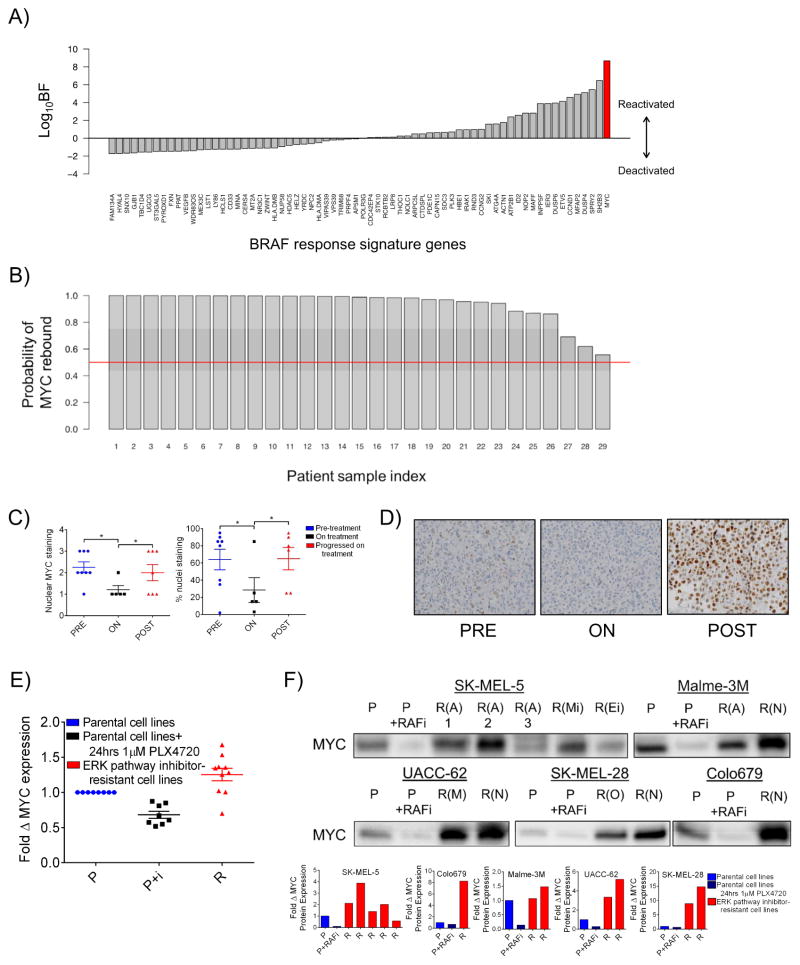
Figure 1. MYC is a potential convergent effector of diverse resistance pathways in BRAF mutant melanoma tumors that have progressed on treatment with BRAF/MEK inhibitors.
A) Bayes Factor (BF) values for BRAF response signature genes. B) Probability of MYC rebound to pretreatment or greater expression levels in each of 29 patient tumors with acquired resistance to vemurafenib. C) Matched patient samples pre-treatment (PRE), on treatment (ON) with RAF and/or MEK inhibitor, or after progression on treatment (POST). Nuclear MYC staining scored 0: none to 3: maximum (left panel) and percent nuclei staining positive for MYC (right panel). D) Representative images from the data shown in C) at 40X magnification. E) MYC mRNA transcript levels in cell lines with evolved resistance. Data are means of 3 experiments in clonal cell lines normalized to β-actin transcript levels and parental MYC levels. Parental cells were treated with 1μM PLX4720 or DMSO for 72 hrs. F) MYC protein levels shown by immunoblotting. Parental lines (P) were treated with DMSO or 1 μM PLX4720 for 24 hrs and resistant lines (annotated as R(A), PI3K-AKT-mTOR-driven resistance; R(N), Notch1-driven resistance; R(M), ERK reactivation-driven resistance; R(O), other/unknown resistance mechanism; R(Mi), evolved resistance to MEK inhibitor, AZD6244; R(Ei), evolved resistance to ERK inhibitor, VX-11E) were treated with 3 μM PLX4720. Quantification of MYC protein normalized to total protein is shown in the bottom panel and total protein staining is shown in Figure S1C. *P < 0.05. See also Figure S1 and Table S1, Tabs 1–4.

