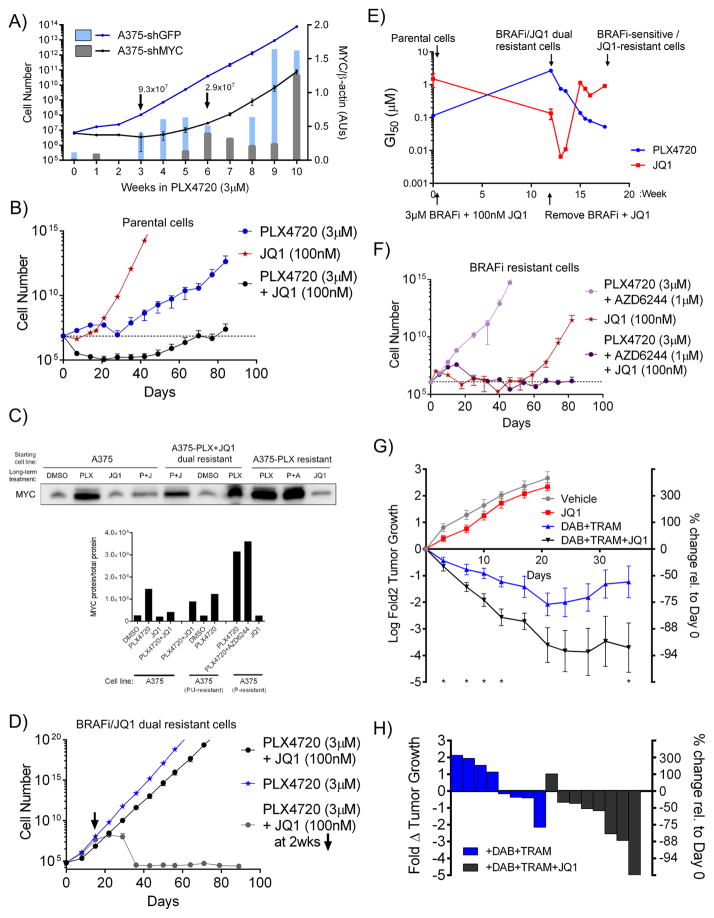
Figure 5. MYC suppression delays the emergence of resistance to BRAF inhibition in vitro and in vivo.
A) Lines indicate cell numbers calculated from weekly measured growth of A375 cells expressing shGFP or shMYC and cultured in 3μM PLX4720 (left axis). Bars indicate quantification of MYC levels in extracts made at the indicated times normalized to β-actin levels (right axis). B) Cell numbers calculated from growth rates of A375 cells cultured in 3 μM PLX4720, 100 nM JQ1, or the combination. C) Immunoblot of MYC in cell lines generated in B), D) and F). D) Cell numbers calculated from growth rates of A375-PLX+JQ1 dual resistant cells cultured in 3 μM PLX4720 or 100 nM JQ1 and 3 μM PLX4720. E) GI50 values of cell lines generated in B) and D) treated with PLX4720 or JQ1. Quantification of MYC protein normalized to total protein and total protein staining is shown in Figure S5C. F) Cell numbers calculated from growth rates of A375-PLX resistant cells cultured in 3 μM PLX4720 and 1 μM AZD6244 (MEKi), 100 nM JQ1, or the combination. G) Growth of A375 xenograft tumors treated with vehicle, JQ1 (45 mg/kg/d), dabrafenib (Dab, 30 mg/kg/d) plus trametinib (Tram, 0.6 mg/kg/d), or the combination over time. Data shown are mean tumor volume +/− SEM, with n=6–8 mice per group. P values were calculated using the one-sided Mann-Whitney test, *p<0.05. H) Waterfall plot showing tumor sizes in the indicated groups from panel G) on day 45 of treatment. For B) and F), dashed line indicates initial seeding number. All data are means (SD) from 3 experiments. *P < 0.05; **P < 0.01; ***P < 0.005; ****P < 0.001. See also Figure S5.

