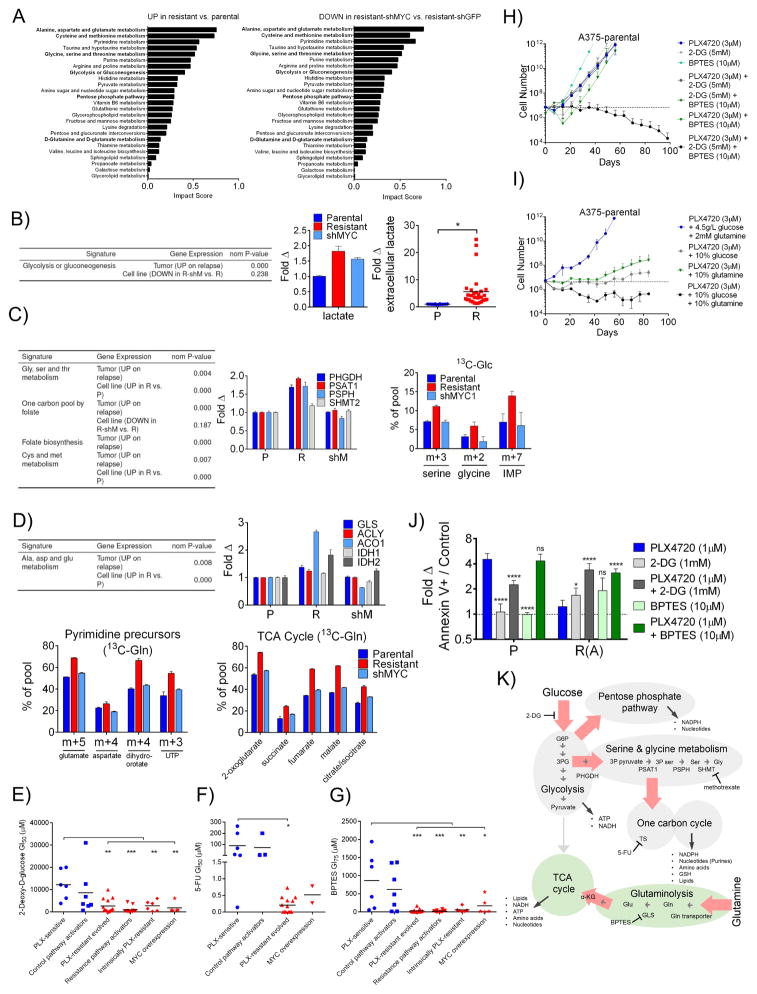
Figure 7. MYC activation in BRAFi resistant cells induces changes in the activities and dependencies associated with targetable metabolic pathways.
A) Top scoring metabolic pathways (Metaboanalyst) enriched in either resistant A375-shGFP (R) relative to parental A375-shGFP (P) cells or enriched in R relative to resistant A375-shMYC (shM) cells. Pathways are ranked by impact score in the former comparison. B) GSEA analysis (left) of differential gene expression in patient tumors and cell lines, in each case comparing resistant samples to their sensitive counterparts. Fold change (middle) in lactate levels in resistant and shMYC cells relative to parental. Fold change (right) in extracellular lactate in a panel of PLX-sensitive (blue) and PLX-resistant (red) cell lines normalized to cell number. C) GSEA analysis as in B) (left). Fold change in mRNA transcript levels for the indicated serine metabolism genes in P, R and shM cells (middle). 13C-glucose incorporation in the indicated metabolites in P, R and shM cells cultured after 24 hours in 13C-glucose (13C-Glc) (right). D) GSEA as in B) (upper left). Fold change in mRNA transcript levels for the indicated glutaminolysis pathways in P, R and shM cells (upper right). Relative abundance of 13C-glutamine (13C-Gln) for glutamate, aspartate and all TCA cycle intermediates (except citrate/isocitrate and dihydroorotate, m+4, and UTP, m+3) in P, R and shM cells cultured for 24 hours in 13C-Gln (lower left and right, respectively). E) GI50 values in multiple cell line models treated with the glycolysis inhibitor, 2-deoxy-D-glucose. F) GI50 values of lines treated with 5-FU. G) GI50 values of lines treated BPTES. Data in E), F) and G) are means of 3 experiments. P values denote significance between parental and each of the resistant groups measured by ordinary one-way ANOVA. PLX4720-sensitive cell lines are in blue and resistant cell lines are in red. H) Projected numbers of A375 cells over time during continuous culture in 3 μM PLX4720, 5 mM 2-DG, 10 μM BPTES, the double combinations, or the triple combination. I) A375 cell numbers during continuous culture in 3 μM PLX4720 in either normal DMEM containing 4.5 g/L glucose and 2mM glutamine, DMEM containing 0.45 g/L glucose and 2 mM glutamine, DMEM containing 4.5 g/L glucose and 200 μM glutamine, or DMEM containing 0.45 g/L glucose and 200 μM glutamine. In H) and I), a dashed line indicates initial seeding number. J) Fold change compared to DMSO in the annexin V+ cell population fraction in parental (P) or resistant (R(A)) A375 cells treated with 1 μM PLX4720, 1 mM 2-DG, 10 μM BPTES or the combinations for 3 days. P values are shown comparing each treatment to PLX4720 treatment. K) Summary of metabolic changes found between P, R and shM cell lines. Red arrows indicate metabolic flux increased in resistant cells and returned to parental levels upon MYC knock down. NADPH: Nicotinamide adenine dinucleotide phosphate GSH: glutathione ATP: Adenosine triphosphate NADH: Nicotinamide adenine dinucleotide G6P: glucose-6-phosphate 3PG: 3-phospho-glycerate 3P pyruvate: 3-phospho-pyruvate 3P ser: 3-phospho-serine Ser: serine Gly: glycine Gln: glutamine Glu: glutamate α-KG: α-ketoglutarate. Relationships are derived from a combination of gene expression, metabolite levels and glucose and glutamine 13C isotope tracing data. All data except E), F) and G) are means (SD) from 3 experiments. *P < 0.05; **P < 0.01; ***P < 0.005; ****P < 0.001. See also Figure S7.

