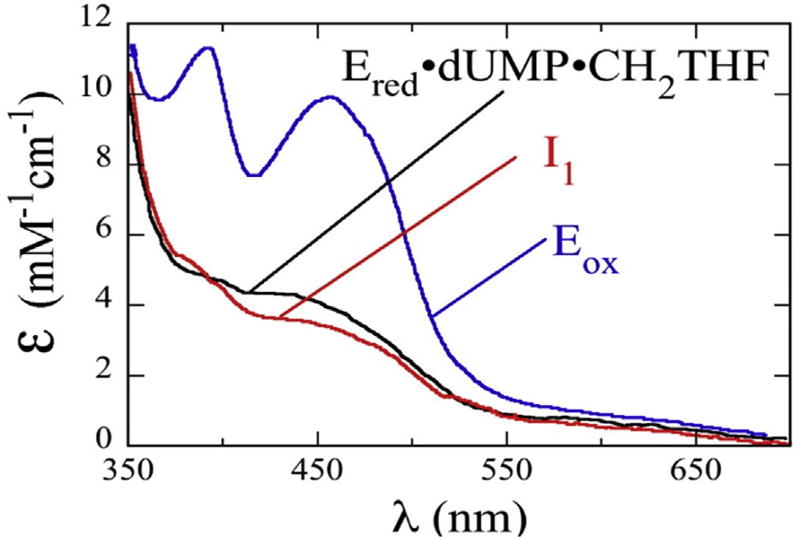
Fig. 3.
Absorbance spectra of FDTS catalysis. These are deconvoluted spectra generated from using singular-value decomposition of raw absorption data fit to a two-step reaction. The blue trace is oxidized enzyme, the black trace is the reduced enzyme complex, and the red trace is suggested to be a bound flavin intermediate. Adapted from Ref. [34].

