. 2017 Dec 4;6:e28415. doi: 10.7554/eLife.28415

Figure 1. Bulk RNA-seq confirms the unique molecular profile of cells at the invasive front of the neural crest stream.

(A) Schematic representation of method used for harvesting samples from the cranial NC stream. Invasive front (Front) is the ventral-most 5% of NC cells. Stream is the remaining 95% of NC cells. n values as shown. (B) Heatmap of biological replicates of differentially expressed genes in HHSt13 and 15 Front and Stream (n = 477 genes). Black boxes contain gene clusters expressed at significantly higher and lower levels by the Front. (C) Heatmap of mean values of differentially expressed genes in HHSt13 and 15 Front and Stream samples (n = 477 genes). Black boxes contain gene clusters expressed at significantly higher and lower levels by the Front. (D) Venn diagram displaying the numbers of genes enriched at the Front of the NC stream at both HHSt13 and 15 with a union of 23 genes enriched in both comparisons. (E) Venn diagram displaying the numbers of genes reduced at the front of the NC stream at both HHSt13 and 15 with a union of 19 genes reduced in both comparisons. Hamburger and Hamilton (1951); St, stage.

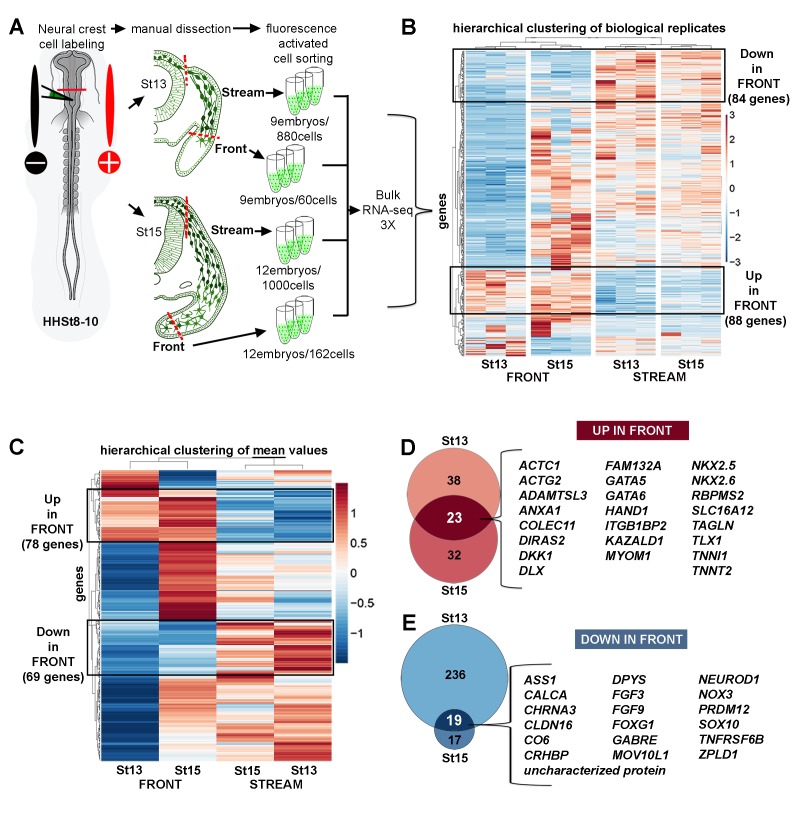
Figure 1—source data 1. Bulk RNA-seq differential expression gene lists.
All differential expression thresholds were set at log2 fold-change (FC) greater than 2 or less than −2 and False Discovery Rate (FDR) less than 0.05. Individual pairwise comparisons are displayed as individual tabs within the spreadsheet.
elife-28415-fig1-data1.xlsx (201.9KB, xlsx)
DOI: 10.7554/eLife.28415.004

Figure 1.

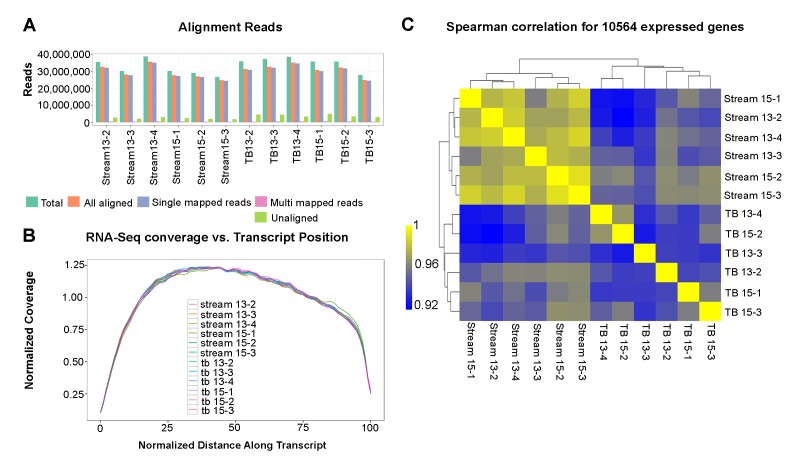
Figure 1—figure supplement 1. Bulk RNA-seq quality control analyses.

Figure 1—figure supplement 1.

(A) Bulk RNA-seq sample alignment metrics, where ‘Total aligned’ represents the number of fragments in FASTQ files and ‘All aligned’ is the sum of single- and multi-mapped reads. (B) Average normalized coverage calculated using Picard for the top 1000 expressed transcripts to measure the evenness of coverage. The plot shows the coverage versus position on the transcript for all samples, with all transcripts scaled to a length of 100. (C) Clustered Spearman correlation between all sample biological replicates based upon genes expressed at FPKM > 2 in at least one sample. Note all correlations are greater than 0.9.