. 2017 Dec 4;6:e28415. doi: 10.7554/eLife.28415

Figure 2. Single-cell RNA-seq shows in vitro and in vivo neural crest have distinct molecular signatures.

(A) Schematic representation of method used for harvesting samples from the cranial NC stream. Front is the ventral-most 5% of NC cells. Lead is the 25% of NC cells immediately following the Front cells. Trail is the remaining dorsal-most 70% of NC cells. Neural crest cells grown in vitro overnight from isolated neural tubes were also isolated for this analysis. (B) Numbers of single cells isolated from different subpopulations. (C) Pearson correlation matrix of the average expression profiles, based upon all differentially expressed genes all subpopulations analyzed (n = 1355 genes). (D) Principal Component Analysis (PCA) of all in vitro and in vivo single cells using all differentially expressed genes (n = 1355 genes). (E) Condensed Gene Ontology (GO) analysis of genes upregulated in in vivo NC cells compared to in vitro NC cells (n = 806 genes). (F) Bar chart displaying NC relevant genes increased in in vivo NC cells compared to in vitro NC cells. HH, Hamburger and Hamilton (1951); St, stage.

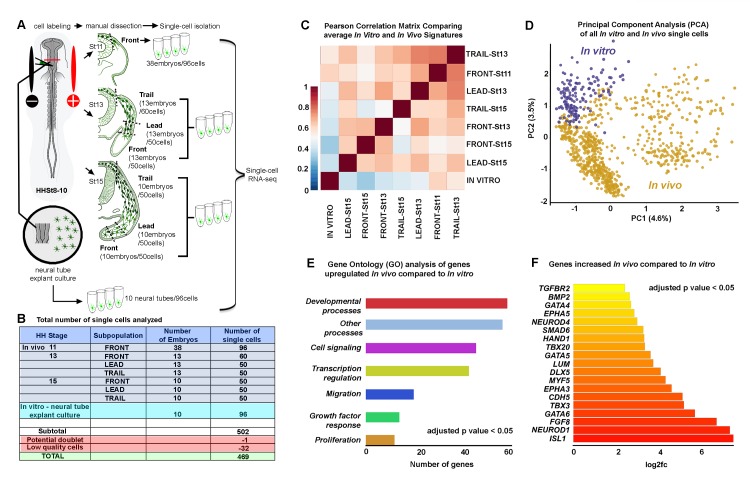
Figure 2—source data 1. Single-cell RNA-seq differential expression gene lists for all spatiotemporal subpopulation pairwise comparisons.
All differential expression thresholds were set at log2 FC greater than 2 or less than −2 and adjusted p value less than 0.05. Individual pairwise comparisons are displayed as individual tabs within the spreadsheet.
DOI: 10.7554/eLife.28415.008
Figure 2—source data 2. Single-cell RNA-seq differential expression gene list comparing in vitro and in vivo cells.
Differential expression threshold was set at log2 FC greater than 2 or less than −2 and adjusted p value less than 0.05.
elife-28415-fig2-data2.xlsx (162.2KB, xlsx)
DOI: 10.7554/eLife.28415.009

Figure 2.

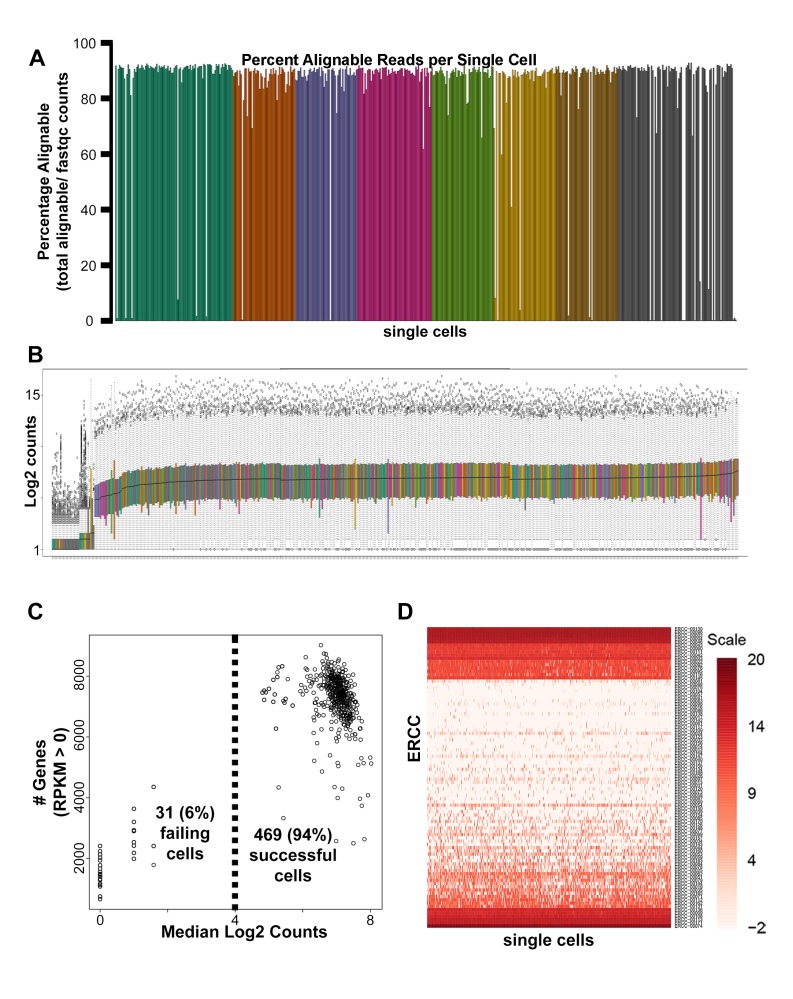
Figure 2—figure supplement 1. Single-cell RNA-seq quality control analyses.

Figure 2—figure supplement 1.

(A) Mapped read percentages for all single cells sequenced (n = 500). Two cells of the 502 cells harvested (0.4%) failed cDNA quality control measures and were not subsequently sequenced. (B) Box plots of log2 counts for 500 sequenced single cells. (C) Scatter plot of median log2 read count versus number of genes detected for each single cell sequenced. 31 (6.2%) of the 500 single cells sequenced were removed from downstream analysis due to distinctly lower counts (B–C). (D) Heatmap of log2 RPKM obtained for all External RNA Controls Consortium (ERCC) spike-ins across all single cells sequenced.
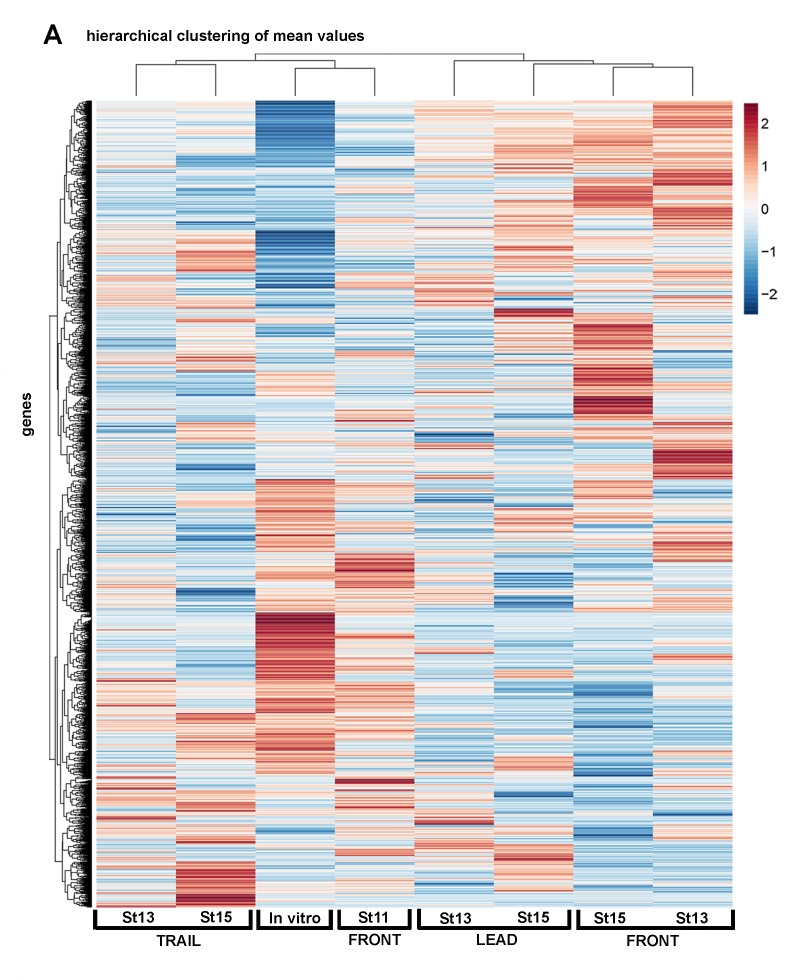
Figure 2—figure supplement 2. Single-cell RNA-seq averages show regional and temporal expression differences within the neural crest stream.

Figure 2—figure supplement 2.

Heatmap of single cell mean values of differentially expressed genes of all cell subpopulations analyzed (n = 1355 genes).