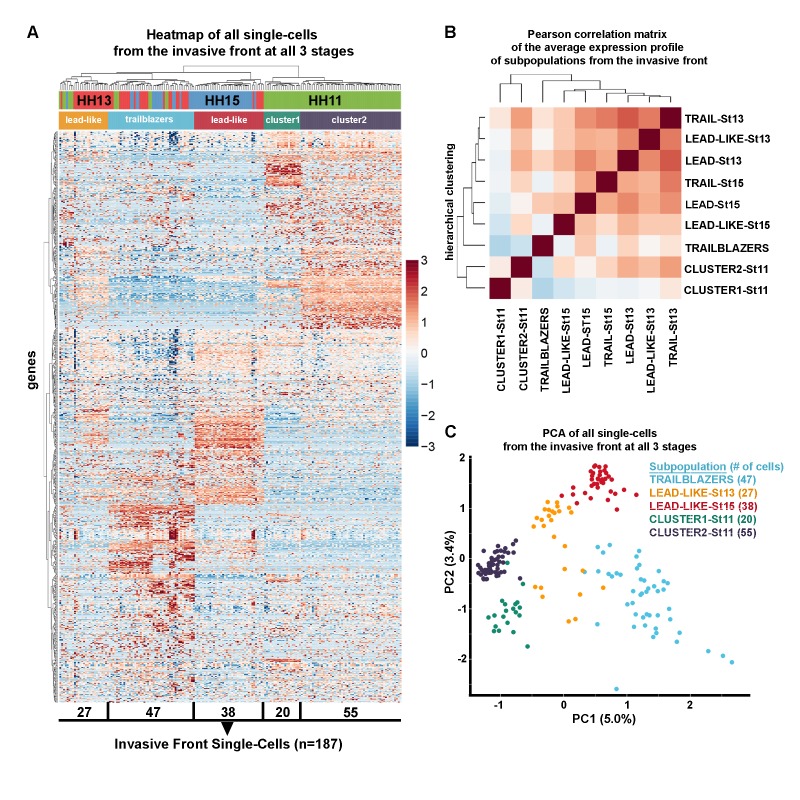
Figure 4. Trailblazers are a small subpopulation of cells with a distinct expression signature that exist at the invasive front of the neural crest stream, regardless of developmental stage.
(A) Heatmap with hierarchical clustering of all single cells from the invasive front at HHSt11, 13 and 15 (n = 187 cells), based upon differentially expressed genes from all invasive front comparisons and invasive front compares to stream at HHSt13 and HHSt15 (n = 760 genes). (B) Pearson correlation matrix of the average expression profile of all subpopulations based upon differentially expressed genes from all invasive front comparisons and comparisons between clusters and all other in vivo cells (n = 3555 genes). (C) PCA of all single cells from the invasive front at all three developmental time points, based upon differentially expressed genes from all invasive front comparisons and invasive front compares to stream at HHSt13 and HHSt15 (n = 760 genes).

