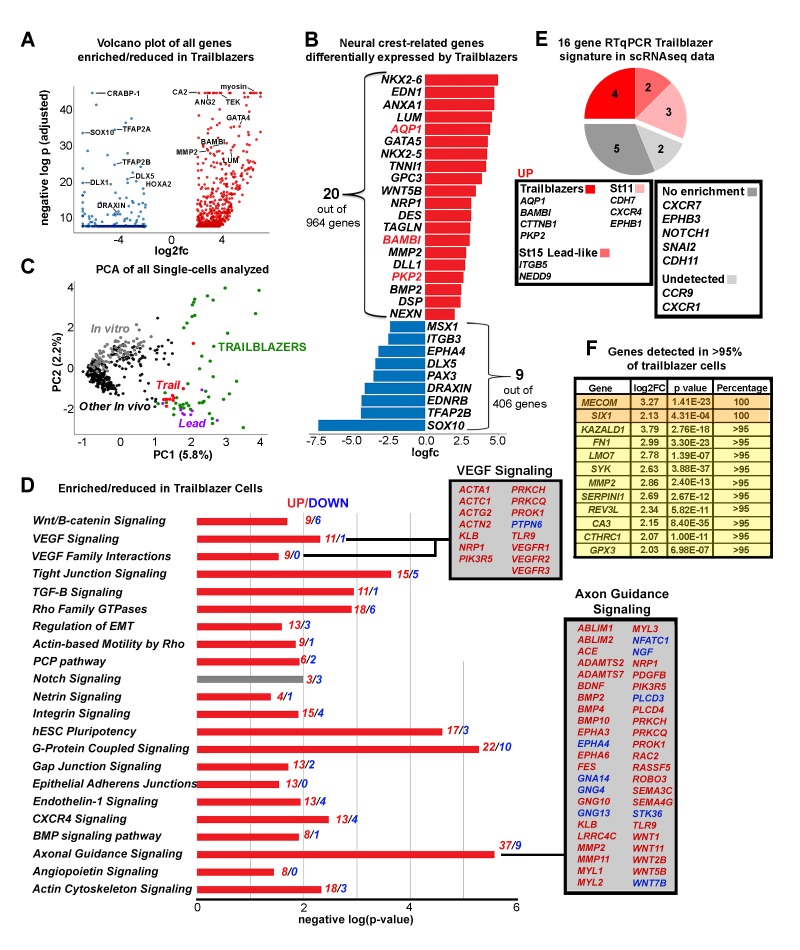
Figure 5. The Trailblazer signature represents tissue development, adhesion and a lack of differentiation.
(A) Volcano plot of all genes statistically enriched or reduced in Trailblazers (n = 47 cells, 1370 genes). (B) Bar chart showing examples of neural crest-related differentially expressed genes in Trailblazers (red designates previously identified in McLennan et al., 2015). (C) PCA of all single cells analyzed showing minimal overlap of other in vivo (black dots) and in vitro (gray dots) with the Trailblazers (green dots) (n = 1370 genes). (D) Significant signaling pathways predicted to be enriched (red) or reduced (blue) in Trailblazers. VEGF and axonal guidance signaling are highlighted. The statistical significance was set at log (−1.3) [p<0.05]. (E) Comparison to previous RT-qPCR generated trailblazer signature. (F) Genes enriched and detected in >95% of trailblazer cells.

