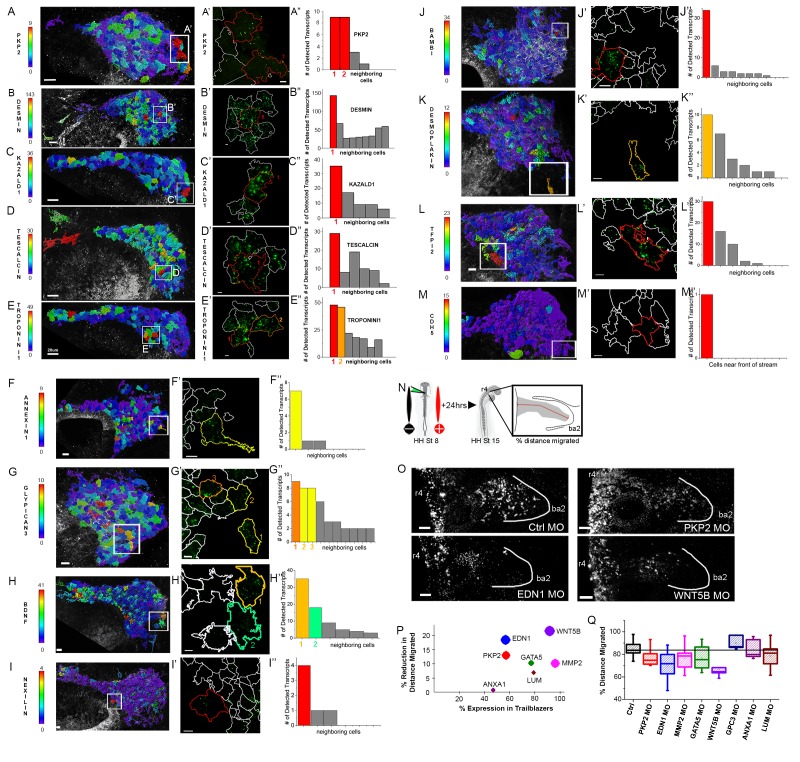
Figure 6. Expression and functional perturbations of selected genes enriched in Trailblazers.
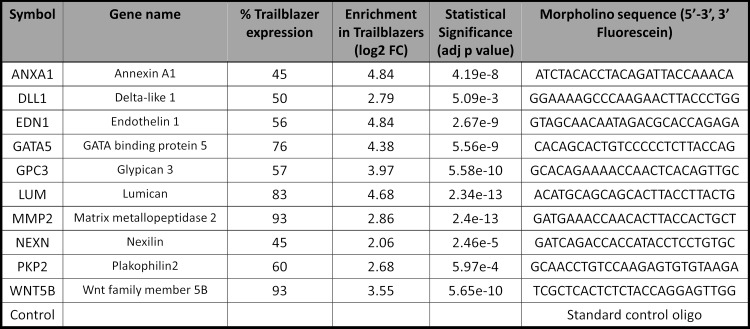
(A–M) Typical cranial neural crest cell migratory streams at HHSt13 adjacent to rhombomere 4 (r4) with HNK-1-positive cells color coded by the number of PKP2 (Plakophilin 2; A), Desmin (B), KAZALD1 (Kazal Type Serine Peptidase Inhibitor Domain1; C), Tescalcin (D), Troponin I1 (E), Annexin1 (F), Glypican 3 (G), BDNF (Brain Derived Neurotrophic Factor; H), Nexilin (I), BAMBI (BMP and Activin Membrane Bound Inhibitor; J), Desmoplakin (K), TFPI2 (Tissue Factor Pathway Inhibitor 2; L), and CDH5 (Cadherin 5; M). RNAscope spots detected per cell. (A’–M’) Single cells outlined with expression were selected from each neural crest cell migratory stream and (A”–M”) the number of RNAscope spots per cell volume for a cell with high expression and adjacent neighboring cells is shown in the bar graphs. (N) Schematic representation of morpholino and electroporation procedure. (O) Morpholino transfected migrating cranial neural crest migration at HHST15 (n = 16 control MO embryos, n = 20 EDN1 MO embryos, n = 20 PKP2 MO embryos, n = 20 MMP2 MO embryos, n = 7 GATA5 MO embryos, n = 5 WNT5B MO embryos, n = 10 GPC3 MO embryos, n = 7 ANXA1 MO embryos, n = 22 LUM MO embryos). (P) Correlation plot of distance migrated and expression in trailblazers. Circle size correlates with statistical significance: PKP2 MO, p=0.017, EDN1 MO, p=0.0004, MMP2 MO, p=0.0032, GATA5 MO, p=0.022, WNT5B MO, p=0.0001 (Q) Box plot of the distance migrated of morpholino transfected neural crest cells as a percentage of the distance from the neural tube to the tip of the branchial arch. HH, Hamburger and Hamilton (1951); St, stage; OV, otic vesicle; MO, morpholino. Bar = 20 um (A–G). Bar = 15 um (H–M). Bar = 50 um (O).


