Figure 1. CRIg+TRMs form a protective barrier to prevent tissue autoimmune infiltration and activation.
(A) The distribution of CRIg+ TRMs within the pancreas. Immunostaining of pancreatic frozen sections of 10-week-old NOD mice. (left) Representative images depicting an intact (upper) and an insulitic (lower) islet, respectively. Red: CRIg; Blue: DAPI. The border of the islet was marked by dotted lines; immune infiltration was highlighted by higher density of DAPI+ dots (n = 9 for intact and n = 8 for insulitic). Bar, 50 um. (right) The numbers of CRIg+ TRMs per islet counted from immunostaining sections of pancreas as in (A). Islets were categorized into intact (free from infiltration) and insulitic groups. (B) The severity of insulitis in 10-week-old NOD and NOD/CRIg KO mice. Hematoxylin and eosin staining of pancreatic paraffin sections. Arrowheads depict massive immune infiltration. Bar, 50 um. (C) Flow cytometric analyses of digested pancreases of NOD/CRIg KO mice and littermate controls (n = 7 in each group). (Left) The percentages of pancreatic Treg cells in age-matched NOD and NOD/CRIg KO mice (mixed of both females and males). (Right) The ratio between Treg cells and CD8+ T cells (n = 7 in each group). (D) The production of IFN-γ in CD4+ Tconv and CD8+ T cells. Pancreatic digestions were the same as in (C). Data are representative of three (A, B) or four (C, D) experiments. Student’s t-test was used. *p<0.05; **p<0.01; ***p<0.001.

Figure 1—figure supplement 1. Tissue-distribution of CRIg+ TRMs.

Figure 1—figure supplement 2. CRIg deficiency does not affect T cells in lymphoid organs.

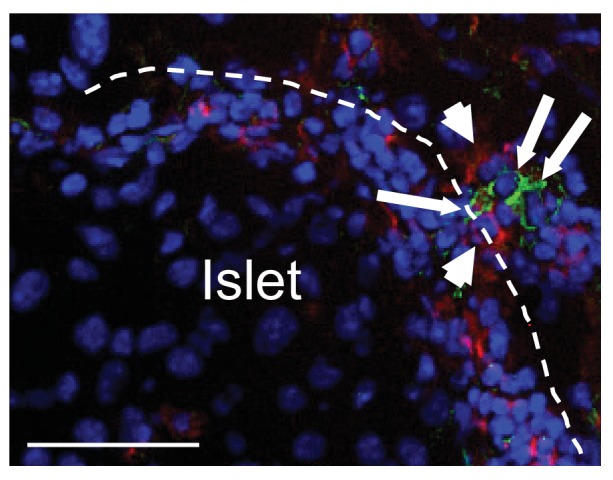
Figure 1—figure supplement 3. Cell-cell contact between CRIg+TRMs and T cells in pancreas.