. 2017 Nov 24;6:e29540. doi: 10.7554/eLife.29540

Figure 2. CRIg suppresses T cell activation.

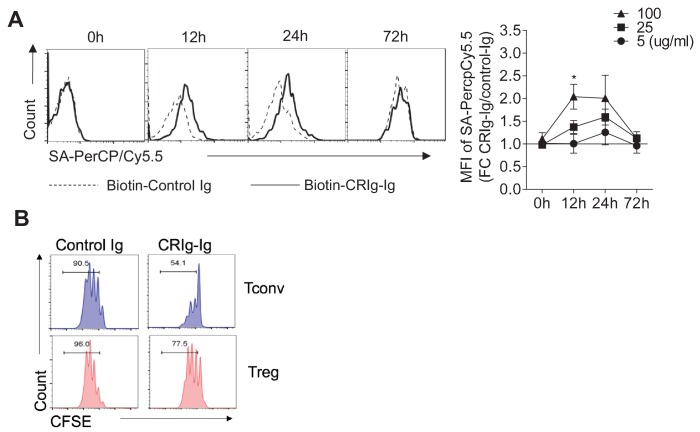
(A) CFSE-labeled CD4+ CD25- Tconv cells were stimulated with anti-CD3/CD28. Plate-bound CRIg-Ig, or control Ig, was added either all time during T cell culture (3 d), or only the first 24 hr, or the late 48 hr. T cell proliferation was measured by CFSE dilution. (B) The expression of early T cell activation markers-CD69 and CD25 in cultured Tconv cells with plate-bound control Ig, or CRIg-Ig. (C) The phosphorylation of early T cell activation cascade proteins. CD4+ CD25- Tconv cells were activated in vitro with anti-CD3/CD28 in the presence of plate-bound control Ig, or CRIg-Ig. (D) The binding of CRIg to activated T cells. CD4+ CD25- Tconv cells were activated in vitro by anti-CD3/CD28 for various lengths of time (12 hr, 24 hr and 72 hr). At each time-point of T cell activation, various concentrations of biotinylated control Ig or CRIg-Ig were incubated with T cells at 37°C for 1 hr. The binding of biotin-labeled Ig proteins was detected using streptavidin-conjugated antibody. (left) Representative histograms of SA-PercpCy5.5 MFIs depicting the binding intensities of biotinylated proteins (25 ug/ml) bound to T cells. (right) Statistical data showing fold-changes of SA-PercpCy5.5 MFIs between CRIg-Ig and control Ig at each time-point and each concentration. P values were calculated by comparing the binding intensities between biotin-CRIg-Ig and biotin-control-Ig. The data are representative from five (A), three (B), and four (C, D) experiments. Student’s t-test was used. *p<0.05; **p<0.01; ***p<0.001, n.s., non-significant.

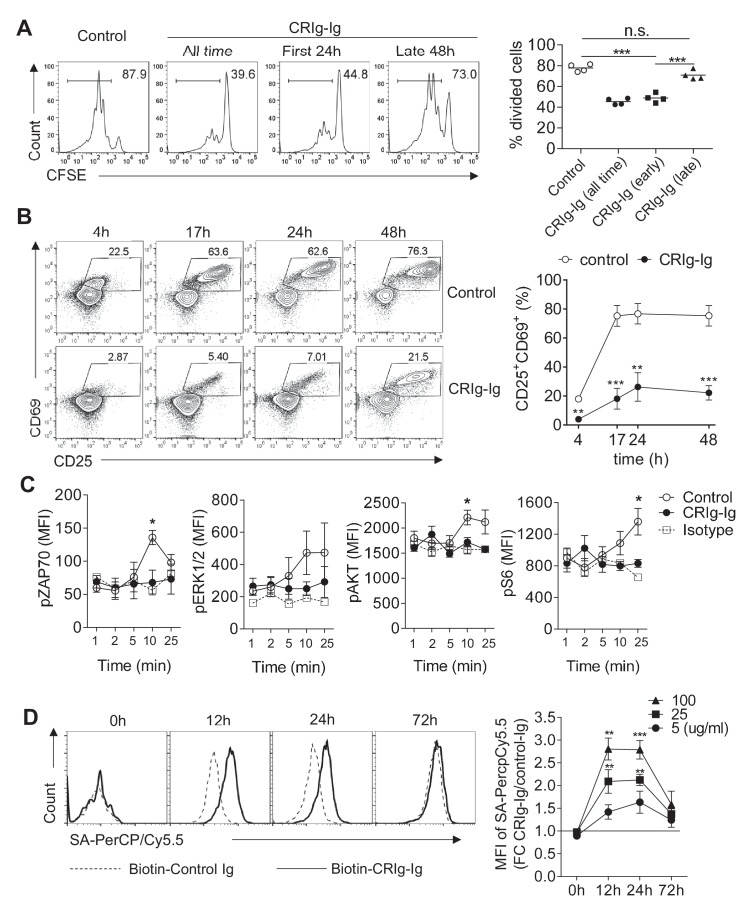
Figure 2.

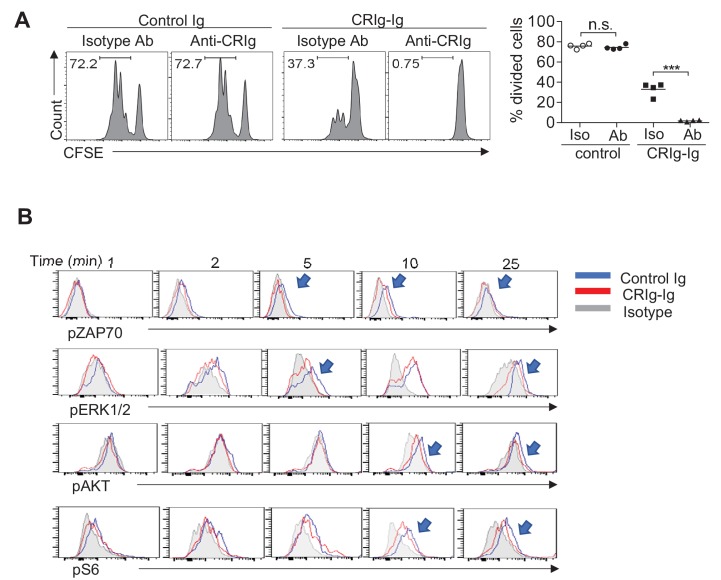
Figure 2—figure supplement 1. The suppressive effect of CRIg on T cells is complement-independent.

Figure 2—figure supplement 1.

(A) CFSE-labeled CD4+ Foxp3(GFP)Tconv cells were stimulated with anti-CD3/CD28, in the presence of plate-coated control Ig, or CRIg-Ig. Soluble anti-CRIg mAb (clone 14G8) was added. T cell proliferation was analyzed by CFSE dilutions after 3 days. (B) CRIg can attenuate TCR signaling in serum-free condition (deprived of complements). Arrow heads depict the suppression of phosphorylation of each respective TCR signaling cascade proteins. Data are representative of four (A) and three (B) experiments. Student’s t-test was used. n.s., non-significant; ***p<0.001.
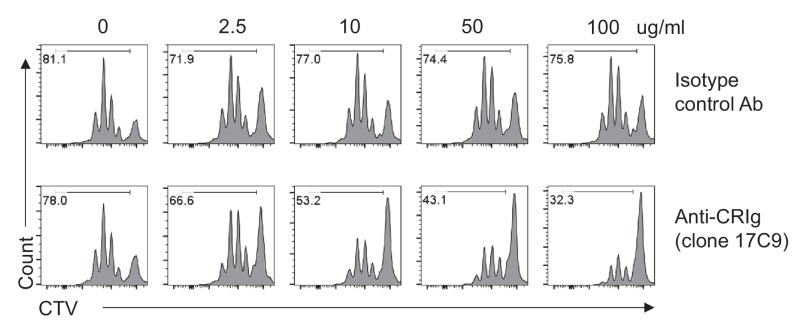
Figure 2—figure supplement 2. Plate-bound anti-CRIg mAb augments the effect of CRIg-Ig in T cells.

Figure 2—figure supplement 2.

CTV-labeled CD4+ Foxp3(GFP)- Tconv cells were stimulated with anti-CD3/CD28, in the presence of plate-coated isotype-matched control mAb, or anti-CRIg-Ig (17C9) (with various concentrations as indicated). Soluble CRIg-Ig was added (5 ug/ml) into the culture medium. After 3 days of culture, cell proliferation was measured by CTV dilution. Numbers depicted proportions of divided cells. Data are representative of three independent experiments.
Figure 2—figure supplement 3. The binding of CRIg to activated Treg cells and differential suppression of CRIg-Ig for Tconv and Treg cells.

Figure 2—figure supplement 3.

(A) CD4+ CD25+ Treg cells were activated in vitro by anti-CD3/CD28 for various lengths of time (12 hr, 24 hr and 72 hr). At each time-point of activation, various concentrations of biotinylated control Ig or CRIg-Ig were incubated with T cells at 37°C for 1 hr. The binding of biotin-labeled Ig proteins to Foxp3(GFP)+ Treg cells was detected using streptavidin-conjugated antibody. (left) Representative histograms of SA-PercpCy5.5 MFIs depicting the binding intensities of biotinylated proteins (25 ug/ml) bound to Treg cells. (right) Statistical data showing fold-changes of SA-PercpCy5.5 MFIs between CRIg-Ig and control Ig at each time-point and each concentration. P values were calculated by comparing the binding intensities of Biotin-CRIg-Ig to Biotin-control-Ig. *p<0.05. (B) Tconv and Treg cells were labeled with CFSE and cultured under the same condition (anti-CD3/CD28, IL-2 with the presence of plate-coated CRIg-Ig or control Ig. Cell proliferation was measured after 3 days of culture. Data were representative of three experiments.
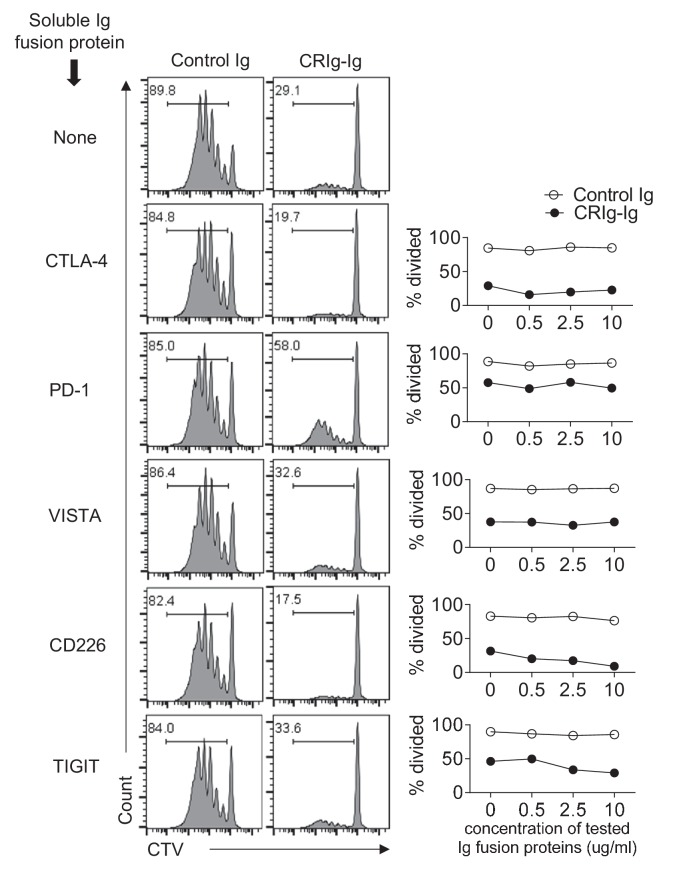
Figure 2—figure supplement 4. Ig fusion proteins of CTLA4, PD-1, VISTA, CD226 and TIGIT do not abolish the suppression of CRIg-Ig in T cells.

Figure 2—figure supplement 4.

CTV-labeled CD4+ Foxp3(GFP)- Tconv cells were stimulated with anti-CD3/CD28, in the presence of plate-coated control Ig, or CRIg-Ig (5 ug/ml). Soluble Ig fusion proteins for CTLA-4, PD-1, VISTA, CD226 and TIGIT (from R and D) were added at indicated concentrations. T cell proliferation was analyzed by CTV dilutions at day 3. Shown are representative of three experiments.