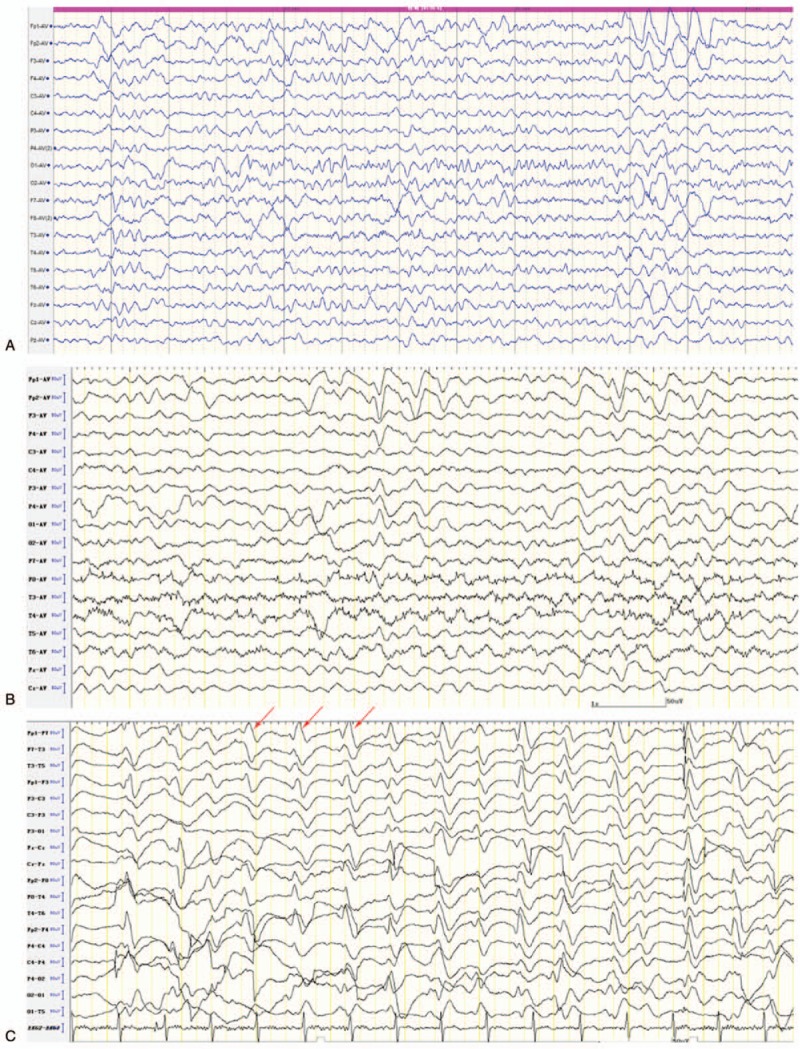
Figure 2.

Interictal EEG. (A) At the 8th week after initial symptom presentation, the EEG showed diffused θ and δ activities. (B) At the 14th week after initial symptom presentation, the EEG showed further slowing of the background, and paroxysmal triphasic waves of bilateral frontal dominancy. (C) At the 16th week after initial symptom presentation, the EEG showed periodic bilateral triphasic sharp wave complexes lasting 300 ms that occurred every 0.5 to 1 s (arrows). EEG = electroencephalogram.
