Figure 1.

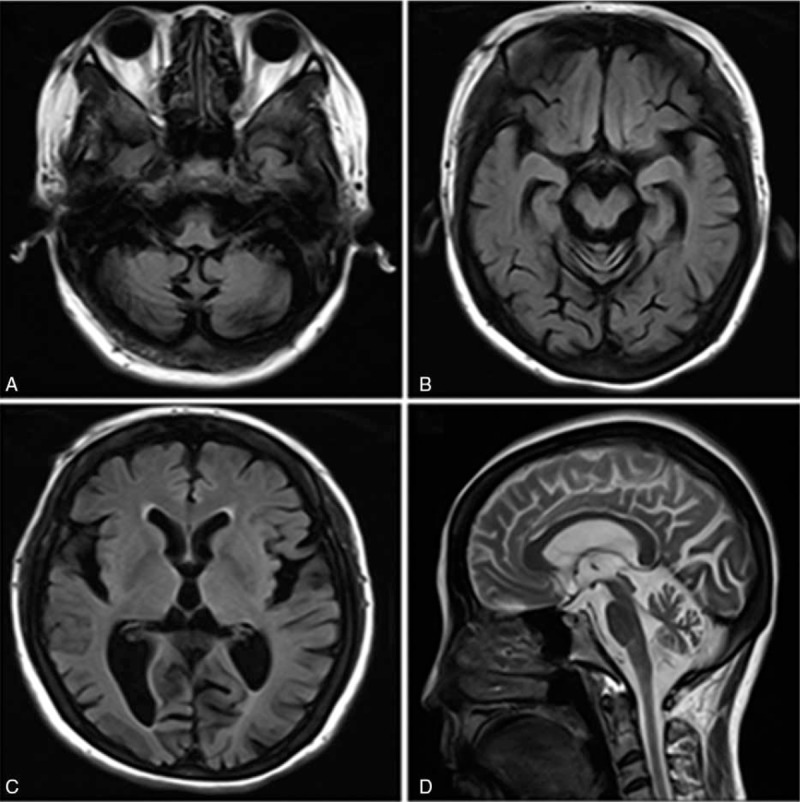
Brain magnetic resonance imaging revealing whole brain atrophy with greatest severity in the cerebellar and brainstem areas. T1W1 (A and B), T2 flair (C), and T2W2 (D).

Brain magnetic resonance imaging revealing whole brain atrophy with greatest severity in the cerebellar and brainstem areas. T1W1 (A and B), T2 flair (C), and T2W2 (D).