Figure 2.

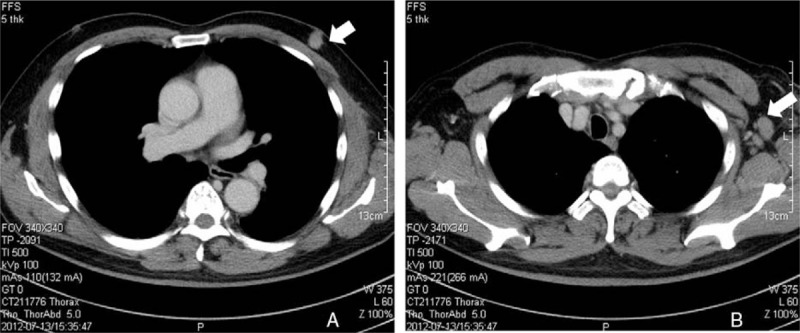
(A) CT scan showing the patient's left subareolar mass (arrow). (B) CT scan showing an enlarged axillary lymph node (arrow). CT = computed tomography.

(A) CT scan showing the patient's left subareolar mass (arrow). (B) CT scan showing an enlarged axillary lymph node (arrow). CT = computed tomography.