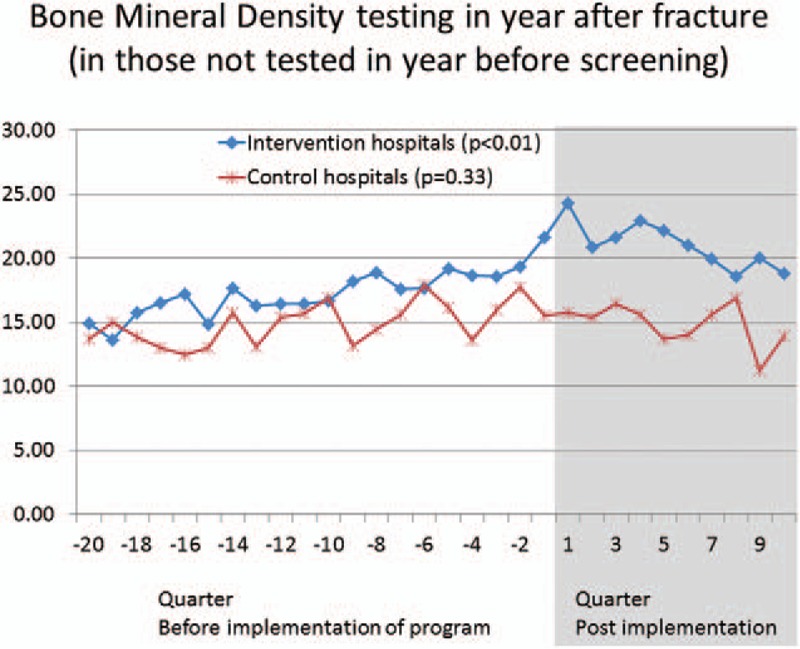
Figure 2.

Graphical depiction of trends for outcomes, divided into pre- and post-implementation phases (vertical line). Main lines (continuing before and after implementation) depict overall trends for intervention sites (blue) and control sites (red boxes).
