Figure 2.

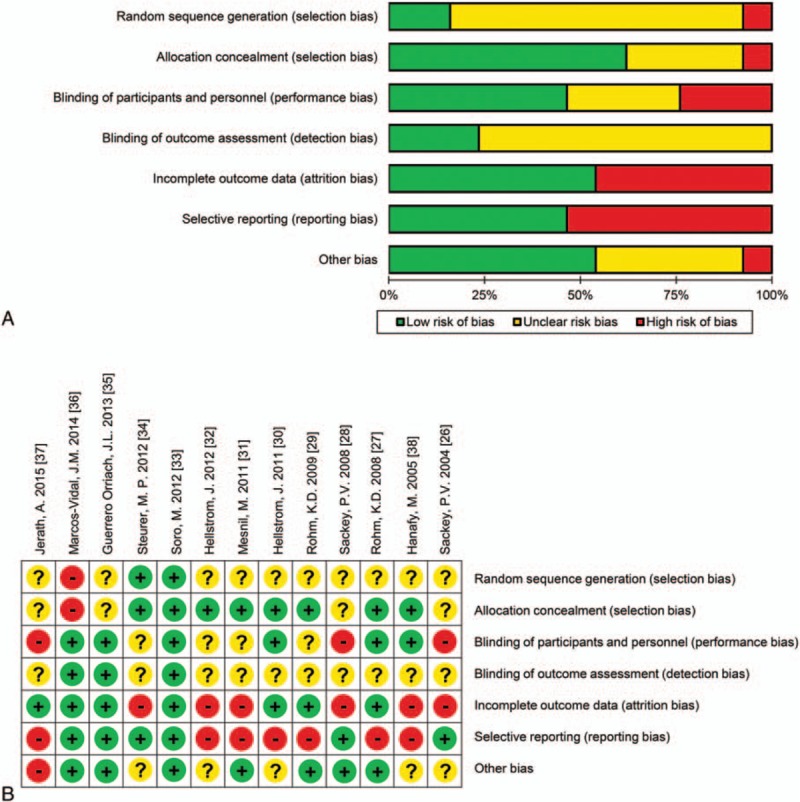
Risk of bias graph (A) and summary (B) of the included studies. + indicates a low risk of bias, − indicates a high risk of bias, and? indicates an unclear risk of bias.

Risk of bias graph (A) and summary (B) of the included studies. + indicates a low risk of bias, − indicates a high risk of bias, and? indicates an unclear risk of bias.