
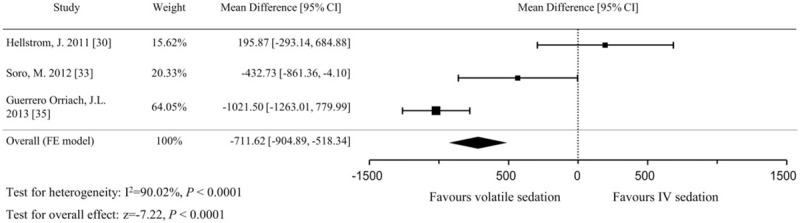
Figure 8.
Forest plot of the mean differences and 95% confidence intervals (CIs) for serum N-terminal prohormone of brain natriuretic peptide levels (pg/mL) on the first postoperative day. Data were analyzed using a fixed effects model.
Official websites use .gov
A
.gov website belongs to an official
government organization in the United States.
Secure .gov websites use HTTPS
A lock (
) or https:// means you've safely
connected to the .gov website. Share sensitive
information only on official, secure websites.
Forest plot of the mean differences and 95% confidence intervals (CIs) for serum N-terminal prohormone of brain natriuretic peptide levels (pg/mL) on the first postoperative day. Data were analyzed using a fixed effects model.