
Figure 3.
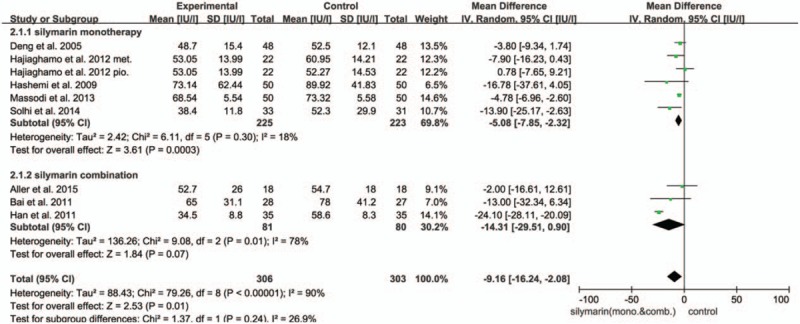
Forest plot of the ALT in the meta-analysis and subgroup analysis. There was a significant difference between the 2 arms (ALT UI/L: MD = −9.16; 95% CI, −16.24 to −2.08; P = .01).
Official websites use .gov
A
.gov website belongs to an official
government organization in the United States.
Secure .gov websites use HTTPS
A lock (
) or https:// means you've safely
connected to the .gov website. Share sensitive
information only on official, secure websites.
Forest plot of the ALT in the meta-analysis and subgroup analysis. There was a significant difference between the 2 arms (ALT UI/L: MD = −9.16; 95% CI, −16.24 to −2.08; P = .01).