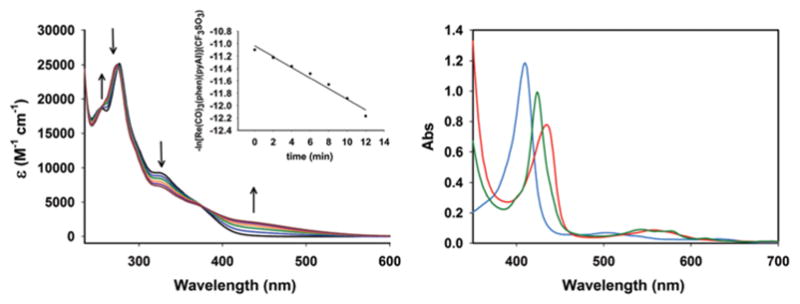
Fig. 2.

Changes in electronic spectrum of 1 (conc., 7.36 × 10⁻⁵ M) in MeCN solution upon exposure to low power UV-B light (λmax = 305 nm, 5 mW cm−2, 2 min intervals) at 298 K (left panel) and UV/Vis traces from the Mb assay for 1 in PBS solution at 298 K (right panel): cyan trace, oxidized Mb; red trace: reduced Mb and green trace: COMb.
