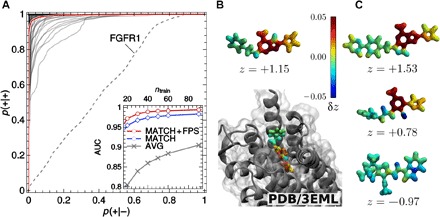
Fig. 4. Predictions of ligand-receptor binding.

(A) ROCs of binary classifiers based on a SOAP kernel, applied to the prediction of the binding behavior of ligands and decoys taken from the DUD-E, trained on 60 examples. Each ROC corresponds to one specific protein receptor. The red curve is the average over the individual ROCs. The dashed line corresponds to receptor FGFR1, which contains inconsistent data in the latest version of the DUD-E. Inset: AUC performance measure as a function of the number of ligands used in the training, for the “best match”–SOAP kernel (MATCH) and average molecular SOAP kernel (AVG). (B and C) Visualization of binding moieties for adenosine receptor A2, as predicted for the crystal ligand (B), as well as two known ligands and one decoy (C). The contribution of an individual atomic environment to the classification is quantified by the contribution δzi in signed distance z to the SVM decision boundary and visualized as a heat map projected on the SOAP neighbor density [images for all ligands and all receptors are accessible online (27)]. Regions with δz > 0 contain structural patterns expected to promote binding (see color scale and text). The snapshot in (B) indicates the position of the crystal ligand in the receptor pocket as obtained by x-ray crystallography (28). PDB, Protein Data Bank.
