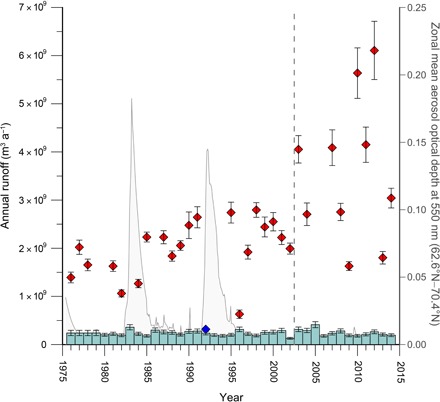
Fig. 3. Annual ice sheet runoff from the Tasersiaq catchment.

The annual runoff from the ice-covered part of the Tasersiaq catchment (left-side y axis). Red, data from regular years; blue, data from volcano-influenced year (only 1992 has sufficient data coverage; see Fig. 2); light blue bars, runoff from the ice-free part of the catchment derived from HIRHAM5, with uncertainties estimated from comparison to winter (September to May) surface mass balance measurements on the Amitsulôq ice cap (marked B in Fig. 1 and fig. S1) (44). Thin gray curve (right-side y axis): zonal mean aerosol optical depth at 550 nm at 66.5°N, indicating the attenuation of the sunlight from the aerosols as it passes through the atmosphere (27). The aerosol optical depth shows distinct peaks in 1983 and 1992 after major volcanic eruptions. The dashed vertical line indicates timing of the hypothesized change in runoff regime.
