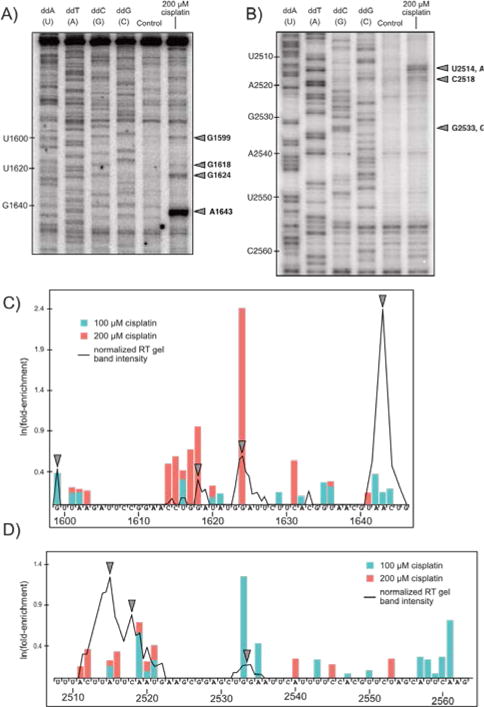
Fig. 4.

Comparison of gel-based RT primer extension analysis with results predicted by Pt-Seq. Two regions of the yeast 25S large ribosomal subunit (A: 1600–1650 and B: 2510–2560) were subject to traditional gel-based primer extension analysis. Lanes 1–4 are dideoxy sequencing ladders, lane 5 is 0 μM cisplatin control, and lane 6 is 200 μM cisplatin (6 hours treatment). Stop sites are marked with arrows. (C, D) Band intensity down each lane (ImageJ) overlaid on a bar plot of Pt-Seq results for both 100 and 200 μM cisplatin, shifted one nucleotide 3′ to illustrate RT stop sites.
