
Figure 5.
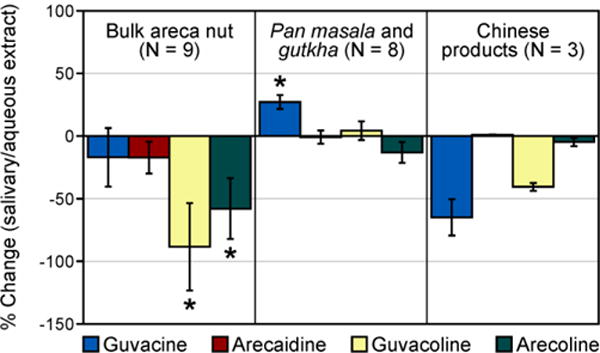
Changes in individual alkaloid levels extracted with artificial saliva expressed as % of the levels measured in aqueous extracts of the same products. Error bars represent standard deviations of the percent change among different products of the same type.
*Statistically significant changes (p < 0.05)