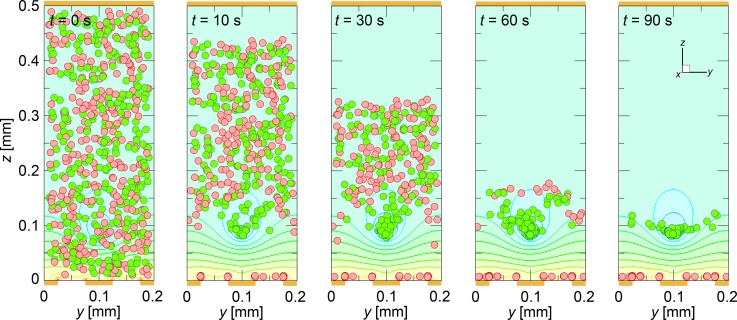
FIG. 7.
The numerical prediction of the cell distribution at times t = 0, 10, 30, 60, and 90 s, after the onset of the application of the AC voltage of Vpp = 20.0 V with a frequency of 10 kHz. Cell distributions are viewed from the downstream end of the calculation domain, looking upstream. The ratio of live and dead cells was 1:1, with a cell volume fraction of ϕ = 3 × 10⁻³. The green and red closed circles are live and dead cells, respectively. The contour lines of the square of the field strength, E*2, are drawn behind the distribution of cells. Positions of electrodes are also shown.

