Abstract
Complex biological processes are often performed by self-organizing nanostructures comprising multiple classes of macromolecules, such as ribosomes (proteins and RNA) or enveloped viruses (proteins, nucleic acids, and lipids). Approaches have been developed for designing self-assembling structures consisting of either nucleic acids1,2 or proteins3–5, but strategies for engineering hybrid biological materials are only beginning to emerge6,7. Here, we describe the design of self-assembling protein nanocages that direct their own release from human cells inside small vesicles in a manner that resembles some viruses. We refer to these hybrid biomaterials as Enveloped Protein Nanocages (EPNs). Robust EPN biogenesis required protein sequence elements that encode three distinct functions: membrane binding, self-assembly, and recruitment of the Endosomal Sorting Complexes Required for Transport (ESCRT) machinery8. A variety of synthetic proteins with these functional elements induced EPN biogenesis, highlighting the modularity and generality of the design strategy. Biochemical and electron cryomicroscopic (cryo-EM) analyses revealed that one design, EPN-01, comprised small (~100 nm) vesicles containing multiple protein nanocages that closely matched the structure of the designed 60-subunit self-assembling scaffold9. EPNs that incorporated the vesicular stomatitis viral glycoprotein (VSV-G) could fuse with target cells and deliver their contents, thereby transferring cargoes from one cell to another. These studies show how proteins can be programmed to direct the formation of hybrid biological materials that perform complex tasks, and establish EPNs as a novel class of designed, modular, genetically-encoded nanomaterials that can transfer molecules between cells.
Subject terms: Protein design, self-assembly, icosahedral symmetry, enveloped viruses, virus assembly, cytoplasmic delivery
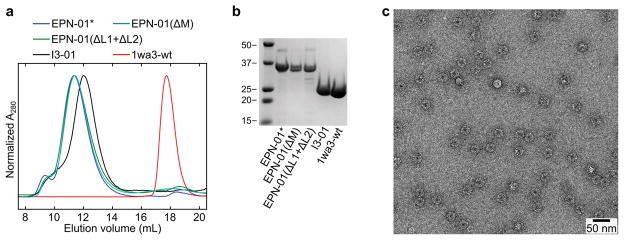
Based on an advancing understanding of enveloped virus assembly, we hypothesized that synthetic proteins could be engineered to direct their own release from eukaryotic cells within membrane envelopes if they encoded three essential activities: membrane binding (termed “M” domain activity), self-assembly (“Interaction” or “I” domain activity), and the ability to recruit ESCRT machinery to catalyse the final membrane fission step required for release from the cell (Late budding or “L” domain activity)8,10,11. To test this hypothesis, we genetically fused peptide sequences capable of membrane binding and ESCRT recruitment onto the computationally designed, 60-subunit nanocage I3-019 to create the EPN-01 constructs (see Fig. 1a and Extended Data Fig. 1a for definitions of EPN-01 and EPN-01*). To promote membrane binding, we added to I3-01 an N-myristoylation signal corresponding to the first six amino acids of the HIV-1 structural Gag protein12. To promote ESCRT recruitment, we added the 52-residue HIV-1 Gag p6 peptide (p6Gag) to the C terminus8,11. Size exclusion chromatography and negative stain EM of EPN-01* expressed in E. coli cells (which lack N-myristoyltransferase and ESCRT factors and therefore produced non-enveloped nanocages) verified that purified EPN-01*, like the core I3-01 scaffold9, self-assembled into regular nanocages ~25 nm in diameter (Extended Data Fig. 2).
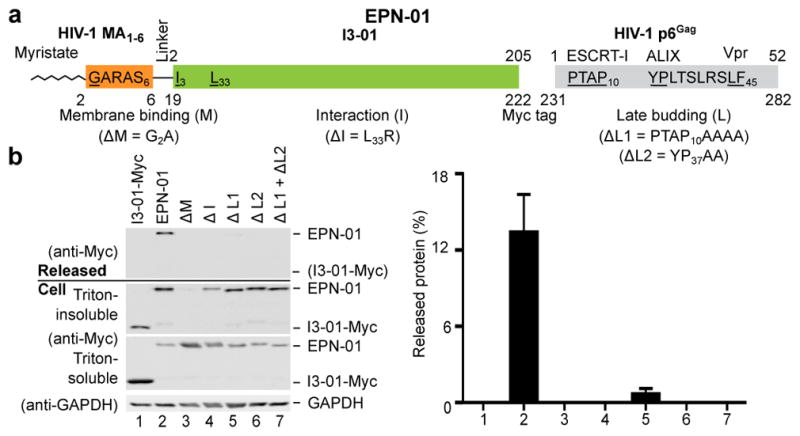
Figure 1. EPN release requires three functional elements.
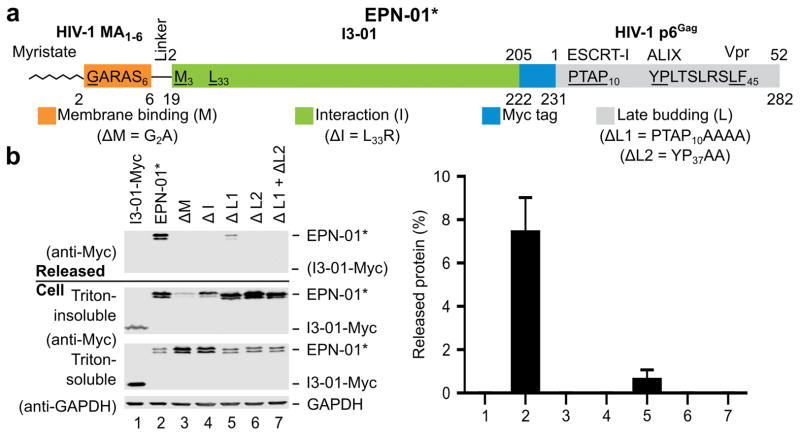
a, Schematic of the EPN-01 construct, with the membrane-binding N-myristoylation element from HIV-1 Gag in orange (underlined G denotes the myristoylated glycine residue), the I3-01 self-assembly domain in green (the L33R mutation has previously been shown to prevent assembly9), the Myc epitope in blue, and the ESCRT-recruiting HIV-1 p6Gag element in grey. The TSG101/ESCRT-I, ALIX, and Vpr-binding sites are shown and key interaction residues mutated in this study are underlined. Residue numbers above the construct correspond to individual functional elements, numbers below correspond to the overall construct. b, Panels 1–4 are western blots showing EPN-01 proteins harvested from 293T cell culture supernatants (Panel 1), cellular EPN-01 proteins in the Triton-insoluble and Triton-soluble fractions (Panels 2 and 3), and a soluble cellular GAPDH loading control (Panel 4). To the right, the percentage of each protein released into the supernatant is plotted (error bars show standard deviations from three technical repetitions).
When expressed in human embryonic kidney 293T cells, 13±3% of the EPN-01 protein was released into the culture supernatant in complexes that could be pelleted by centrifugation through a 20% sucrose cushion (Fig. 1b). In contrast, a core I3-01-Myc scaffold lacking membrane-binding and ESCRT-recruiting elements was not released. Mutational analyses confirmed that each of the three design elements was required for EPN-01 release. Specifically, EPN-01 constructs with point mutations designed to disrupt myristoylation (ΔM)12 or the designed assembly interface (ΔI)9 were not detectably released. Mutations designed to block ESCRT factor recruitment also inhibited EPN-01 release: mutation of the p6Gag TSG101/ESCRT-I binding site reduced EPN-01 release 18-fold (ΔL1), and mutation of the ALIX binding site abrogated release entirely, either alone (ΔL2) or in combination with the TSG101/ESCRT-I binding site mutation (ΔL1 + ΔL2). Similar results were obtained with EPN-01* analogues (Extended Data Fig. 1). These experiments demonstrate that all three design elements – membrane binding, self-assembly, and ESCRT recruitment – are functionally required for release of EPN-01 proteins from human cells.
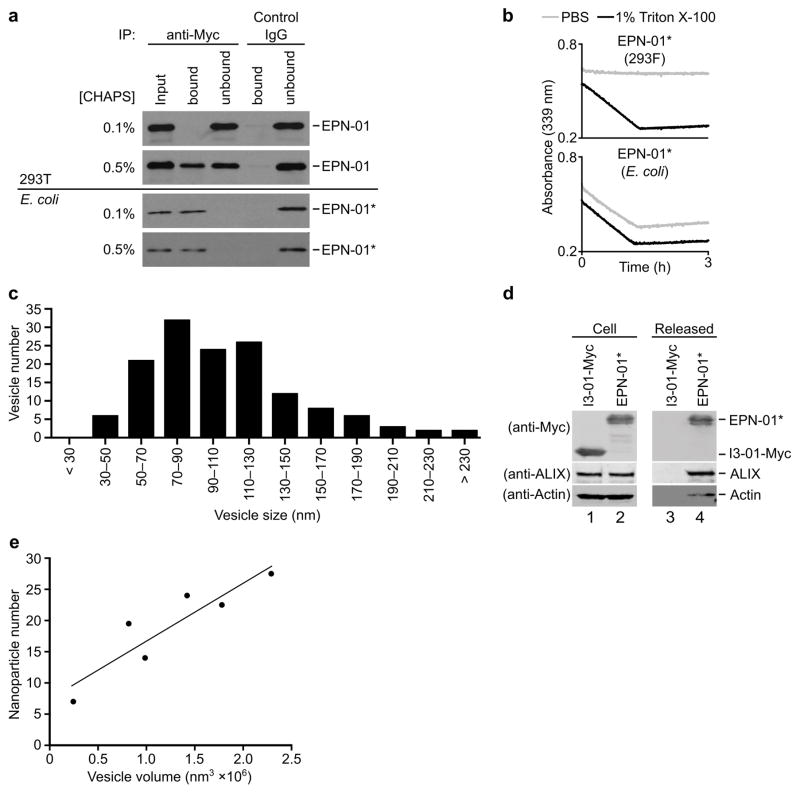
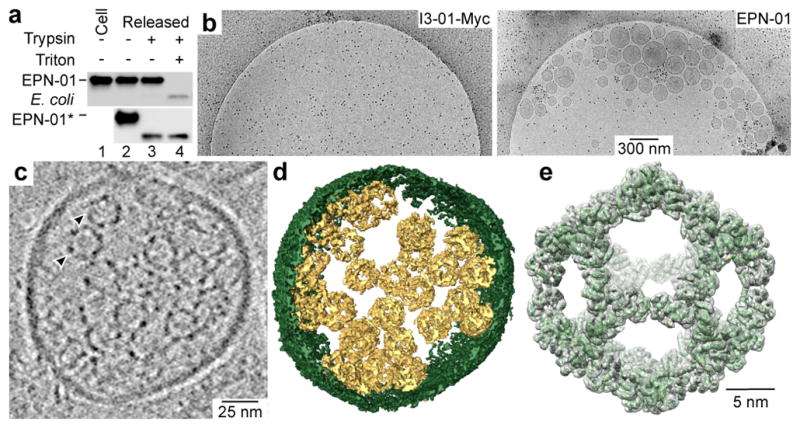
Three different biochemical assays confirmed that released EPN-01 proteins were encapsulated within intact membrane envelopes. Fig. 2a shows that released EPN-01 protein was protected against trypsin digestion in the absence of detergent, but became susceptible in the presence of 1% Triton X-100. In control experiments, non-enveloped EPN-01* nanocages produced in E. coli were degraded by trypsin in both the presence and absence of detergent. Detergent treatment was also required to render released EPN-01 proteins accessible to antibodies or to the small, polar aldolase substrate 2-keto-3-deoxy-6-phosphogluconate (KDPG), as assayed by I3-01 aldolase activity (Extended Data Fig. 3a and b). Thus, EPN-01 proteins were released within intact membrane envelopes that were impermeable to proteins or small polar molecules.
Figure 2. EPNs comprise cell-derived membrane envelopes containing multiple protein nanocages.
a, The upper panel is a western blot showing EPN-01 in 293F cells (lane 1) or released from 293F cells and treated as denoted (lanes 2–4). The lower panel is a western blot showing equivalent samples of non-enveloped EPN-01* nanocages purified from E. coli. b, Representative cryo-EM images showing the levels of extracellular vesicles/EPNs in culture supernatants from 293T cells that expressed I3-01-Myc (left panel) or EPN-01 (right panel). c, Central slice from a cryo-EM tomographic reconstruction of a released EPN; two internal protein nanocages are marked with arrowheads. d, Isosurface model of the 3D cryo-EM reconstruction from (c). The EPN membrane is green and individual protein nanocages are gold. e, Single particle cryo-EM reconstruction of the nanocages released from EPNs following detergent treatment. Charge density from the 5.7 Å resolution EM reconstruction is shown in grey (contoured at 4.5 σ). The I3-01 computational design model9 (green ribbon) was docked into the density as a rigid body.
Several observations indicated that EPN-01 expression induced formation of extracellular vesicles. First, cryo-EM imaging revealed that culture supernatants from 293T cells expressing EPN-01* contained numerous vesicles whereas cells that expressed the control I3-01-Myc did not (Fig. 2b). The vesicles averaged 107 ± 44 nm in diameter, and ranged between 40–320 nm (Extended Data Fig. 3c). Second, ALIX and actin, two cytosolic proteins that are often incorporated into enveloped viruses and exosomes13,14, were released into the culture supernatants of cells that expressed EPN-01* (Extended Data Fig. 3d).
Cryo-EM tomography and 3D reconstructions revealed that each vesicle contained multiple protein nanocages that matched the known shape and size of I3-019. The representative vesicle shown in Figs. 2c, d and Supplementary Video 1 is ~160 nm in diameter and contains 28 identifiable protein nanocages, most of which are associated with membranes, including a small internal vesicle. Reconstructions of EPN-01 vesicles of varying sizes revealed a correlation between vesicle size and nanocage number (Extended Data Fig. 3e).
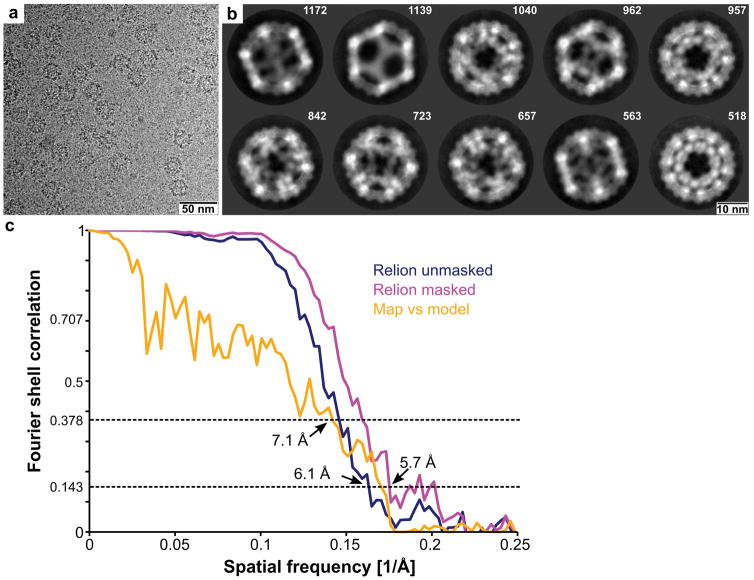
To confirm that the internal protein nanocages corresponded to the design, they were released from the surrounding bilayer by detergent treatment, imaged by cryo-EM, and reconstructed as single particles (Extended Data Fig. 4). A 5.7 Å resolution reconstruction of the released nanocages closely matched the computational I3-01 design model, including the computationally designed two-fold interface between trimeric building blocks (Fig. 2e and Supplementary Video 2). Thus, EPN-01 protein expression induced the formation and release of vesicles that each contained multiple protein nanocages (termed Enveloped Protein Nanocages, hereafter EPNs).
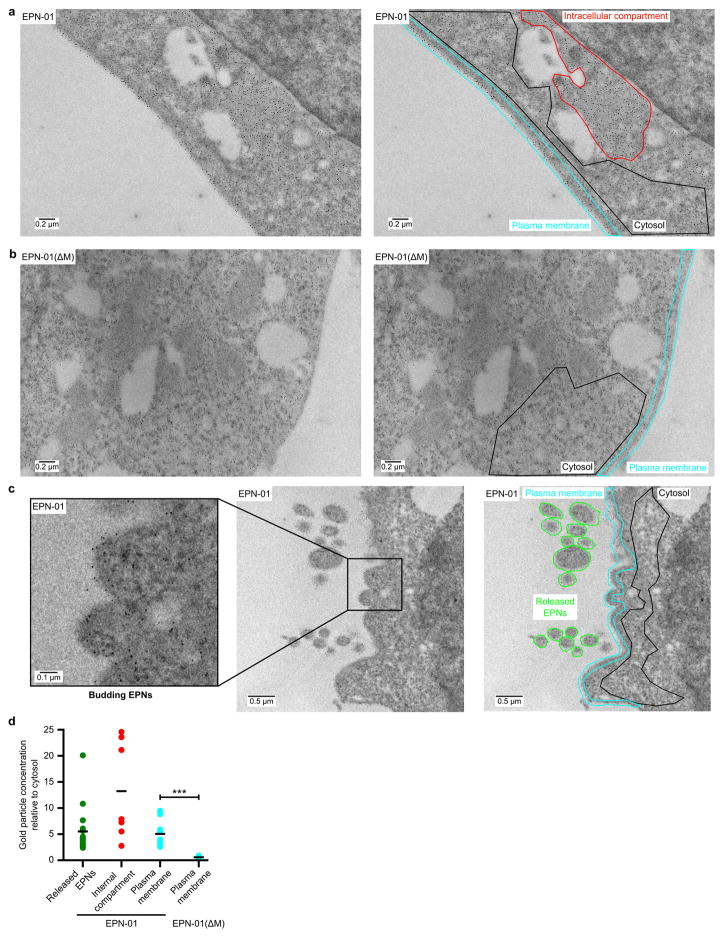
Confocal immunofluorescence microscopy and immunogold EM of thin-sectioned cells expressing EPN-01 showed that the protein localised predominantly to internal compartments, but also to the plasma membrane (Extended Data Figs. 5a, 6a, d). Control analyses of EPN-01(ΔM) confirmed that membrane localisation was dependent upon myristoylation (Extended Data Figs. 5b, 6b, d). Extracellular vesicles were observed and were decorated with anti-Myc immunogold particles as expected. We also occasionally observed immunogold-labeled vesicles that appeared to be in the process of budding from the plasma membrane (Extended Data Fig. 6c). Thus, vesicle biogenesis can apparently occur at the plasma membrane.
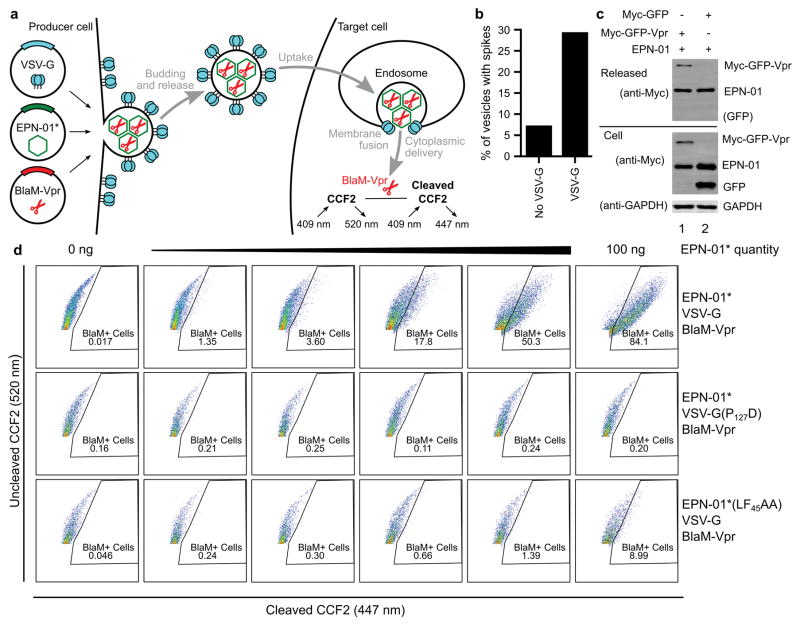
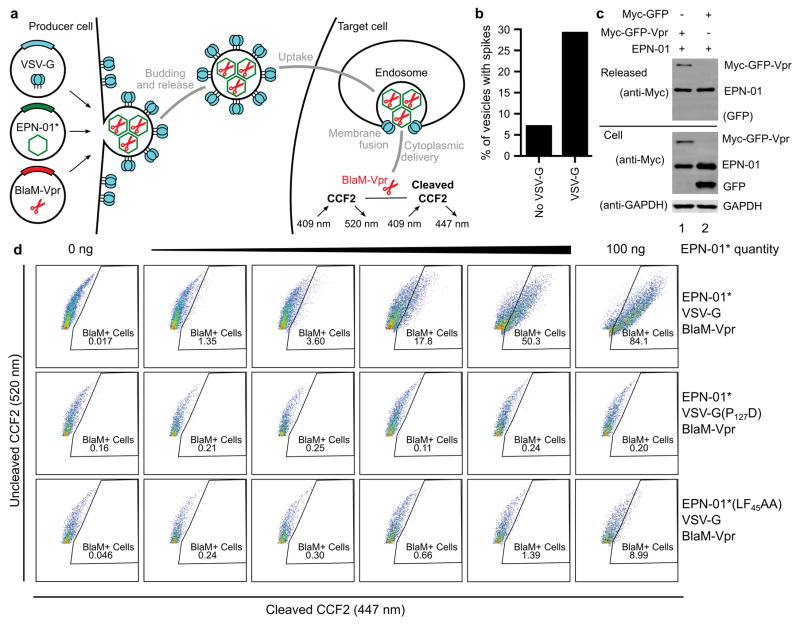
We next tested whether EPNs that incorporated the VSV-G membrane fusion protein could deliver macromolecular cargoes into new target cells. To produce such EPNs, we co-expressed EPN-01* with VSV-G and with a protein comprising the β-lactamase (BlaM) enzyme fused to HIV-1 Vpr (BlaM-Vpr)15,16. BlaM-Vpr was designed to be packaged within the EPN owing to interaction of the Vpr domain with the ESCRT-recruiting p6Gag polypeptide15,17 (Extended Data Fig. 7a).
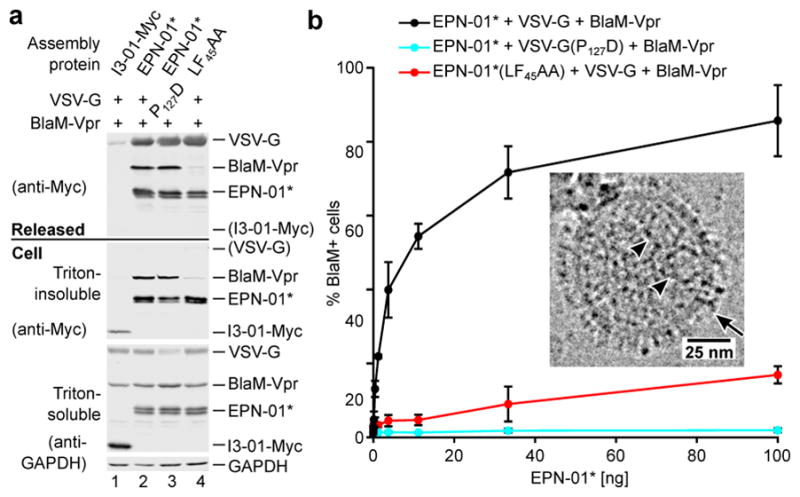
EPN-01*, BlaM-Vpr and VSV-G were efficiently released together from 293T producer cells as designed (Fig. 3a). In contrast, cells that expressed the control I3-01-Myc construct released very little VSV-G and no BlaM-Vpr, indicating that these two proteins were likely released via EPN incorporation. Consistent with this interpretation, the fraction of EPN-01* assemblies with visible surface spikes increased four-fold upon VSV-G pseudotyping (Fig. 3b inset and Extended Data Fig. 7b). Two additional mutant constructs were used as controls to test whether the EPNs functioned as intended. In one case, the co-expressed VSV-G contained a mutation known to inhibit membrane fusion (VSV-G(P127D), Fig. 3a)18. In the other case, the Vpr binding site on the p6Gag polypeptide in EPN-01* was mutated to inhibit Vpr binding (EPN-01*(LF45AA))17. As expected, both control constructs were released efficiently and the level of BlaM-Vpr packaging was significantly reduced for EPN-01*(LF45AA). A similar dependence on the Vpr-p6Gag interaction was observed for GFP-Vpr packaging (Extended Data Fig. 7c).
Figure 3. EPNs can package macromolecular cargoes and deliver them into new target cells.
a, Western blots showing cellular expression and release of I3-01-Myc, EPN-01*, and Myc-tagged VSV-G and BlaM-Vpr constructs (see Supplementary Table 3 for sequence information). Panels are equivalent to those in Fig. 1a. b, Cytoplasmic delivery to target HeLa cells by the three released constructs from (a), plotted as percentages of BlaM-positive cells following incubation with the designated quantities of the different EPNs (error bars show standard deviations from two technical repetitions). Inset: Cryo-EM image of an EPN-01*/VSV-G EPN with internal protein nanocages (arrowheads) and apparent VSV-G envelope spikes (arrow).
Released EPNs were harvested and tested for the ability to deliver their Vpr-BlaM cargoes into target HeLa cells. Delivery efficiencies were quantified by assaying cytosolic BlaM activity in target cells15 incubated with increasing concentrations of functional and mutant EPNs (Fig. 3b and Extended Data Fig. 7d). As designed, the EPNs with wild-type VSV-G and p6Gag fused efficiently with target cells, with >80% of the target cells receiving Vpr-BlaM at the highest EPN-01* levels tested (Fig. 3b, black curve). In contrast, equivalent levels of either mutant EPN produced much lower percentages of BlaM-positive target cells (red and cyan curves). The slight activity of the EPN-01*(LF45AA) EPNs presumably reflected low residual levels of BlaM-Vpr packaging. The inactivity of the VSV-G(P127D)-containing EPNs confirmed that successful delivery required VSV-G-mediated membrane fusion to escape endocytic vesicles and access the cytoplasm.
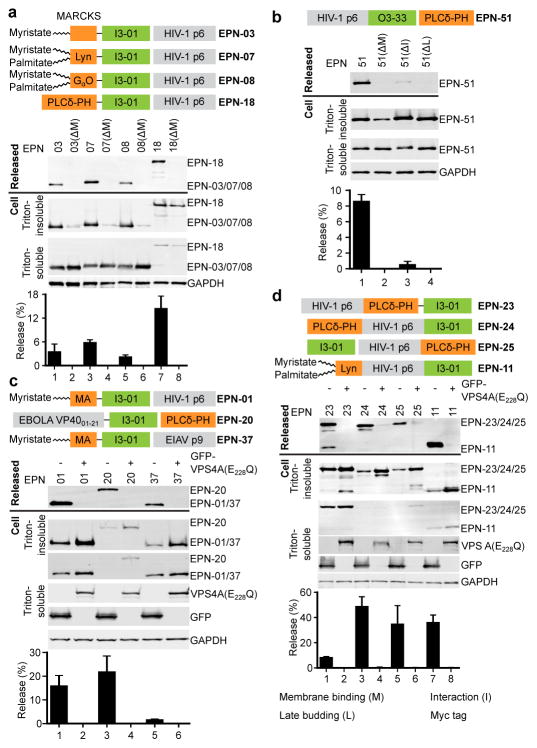
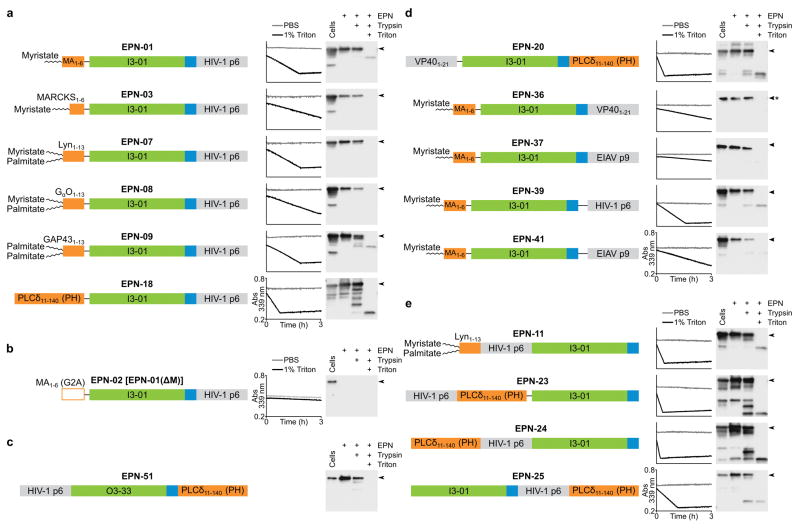
To examine the modularity and generality of EPN design, we designed and tested a series of EPN constructs that carried a variety of membrane-binding, self-assembly, and ESCRT-recruiting elements. 16 of the 43 EPN designs were robustly released from 293F cells within membrane-enclosed vesicles, as judged by the criteria of: 1) detectable EPN release into the supernatant and 2) protease susceptibility and enzymatic activity in the presence, but not absence, of detergent (Extended Data Fig. 8, Supplementary Tables 1 and 2). Seven additional designs showed weak but reproducible detergent-dependent enzymatic activity, while the remaining 20 designed EPN constructs failed to fulfil these criteria, indicating that they had design problems that prevented EPN formation. Nevertheless, the 16 successful designs indicate that the EPN design principles are robust and general.
The survey revealed that a variety of different membrane-binding, self-assembly, and ESCRT-recruiting elements can function in EPN biogenesis. For example, a series of different membrane-binding domains from cellular proteins could substitute for the HIV-1 Gag myristoylation signal, including another fatty acid modification (palmitate) and a peripheral membrane-binding domain (the pleckstrin homology (PH) domain from phospholipase Cδ). These membrane binding domains differed in plasma membrane targeting efficiency (Extended Data Fig. 5), but in every case, point mutations designed to disrupt membrane binding also blocked EPN release, demonstrating a functional requirement for membrane binding.
A second designed self-assembling scaffold that forms a 24-subunit assembly with octahedral symmetry (O3-33)3 could also support EPN formation when fused to an N-terminal p6Gag peptide and a C-terminal PH domain (Fig. 4b). This construct was released efficiently (Fig. 4b), exhibited detergent-dependent protease sensitivity (Extended Data Fig. 8c), and again required membrane-binding, self-assembly, and ESCRT-recruiting activities, as judged by reduced release of inactivating point mutants (Fig. 4b). Similarly, multiple different ESCRT-recruiting elements could also function in EPN release (Fig. 4c and Extended Data Fig. 8d). Examples included the Equine Infectious Anemia Virus (EIAV) p9Gag element, which recruits ALIX19, and an N-terminal element from Ebola Virus VP40 protein, which recruits both TSG101/ESCRT-I and NEDD4 protein family members20. Release was ESCRT-dependent in all cases because EPN production was strongly inhibited by overexpression of a dominant inhibitory version of the VPS4 ATPase that powers the ESCRT pathway21.
Figure 4. A variety of functional elements and protein architectures support EPN formation.
Schematic illustrations of several tested constructs are shown, together with western blots and release quantification. a, Different membrane-binding domains support EPN release (odd lanes). EPN point mutants shown in even lanes were designed to disrupt the membrane-binding interactions. b, The 24-subunit assembly O3-33 can function as an EPN self-assembly domain (lane 1). Mutants shown in lanes 2–4 were designed to disrupt the membrane-binding, self-assembly, and ESCRT-recruiting elements. c, Different ESCRT-recruiting elements can support EPN release (odd lanes). ESCRT-dependent release is demonstrated by loss of EPN release upon co-expression of VPS4A(E228Q) (even lanes). d, Membrane-binding, self-assembly, and ESCRT-recruiting elements can function from different positions within EPN constructs (odd lanes). ESCRT-dependent release is demonstrated by loss of EPN formation upon co-expression of VPS4A(E228Q) (even lanes). Error bars show standard deviations from three technical repetitions.
A remarkable property of enveloped viral structural proteins is that the membrane-binding, self-assembly, and ESCRT-recruiting elements can often function from different positions within the polypeptide22, and this was also true of EPNs. For example, constructs in which the PH domain membrane-binding, the I3-01 self-assembly, and the HIV-1 p6Gag ESCRT-recruiting elements were located at different positions in the protein sequence were released efficiently and in an ESCRT-dependent fashion (Fig. 4d, lanes 1–6, Extended Data Fig. 8e, and Supplementary Table 1). Together with the EPN-18 construct described earlier (Fig. 4a, lane 7), these experiments demonstrate that all three required elements can function from the middle, N, or C termini of designed EPN proteins.
It was notable that EPN-01 induced the release of vesicles that typically contained multiple protein nanocages, whereas enveloped viruses typically contain a single capsid within their lipid bilayers (albeit with some interesting exceptions, for example see ref. 23). However, the traditional demarcations between enveloped viruses, non-enveloped viruses, and extracellular vesicles have become increasingly blurred, and there is now strong precedent for EPN-like assemblies in natural systems. One particularly well-characterized system is hepatitis A virus (HAV)24. HAV has traditionally been categorized as a non-enveloped virus, but was recently shown to be released from cultured cells within small vesicles that typically contain multiple viral capsids25. All of the circulating HAV in patient serum is encapsidated within such vesicles, and their release is ESCRT-dependent. Thus, EPN biogenesis may mimic the natural process of HAV assembly and release. We note that simulations have suggested membrane curvature-driven effects promote nanocage clustering in vesicles (and vice-versa)26, and these effects likely contribute to EPN biogenesis. Going forward, we anticipate that the adaptable synthetic EPN systems described here will be useful in elucidating parameters that govern such processes as particle envelopment, membrane curvature, vesicle size, capsid numbers, and target cell entry.
The central importance of biological membranes has inspired several recent approaches for designing biomimetic materials with membrane envelopes27,28 and engineering naturally occurring extracellular vesicles for therapeutic applications29,30. Here, we designed self-organizing protein nanocages that induce their own release inside cell-derived membrane envelopes. A key feature of our strategy is that it enables control over the biogenesis and contents of the materials through modification of EPN protein sequences. EPNs are highly modular and tolerant to significant alterations, suggesting that they could be engineered to incorporate a wide variety of properties and functions tailored to desired applications.
Methods
Plasmids and antibodies
I3-01-Myc and EPN-01* mammalian expression constructs were generated by PCR amplification of the coding sequences from a pET29b-EPN-01* expression vector and transferred into a CMV-based mammalian expression vector (pCMV, DNASU ID: EvNO0060160931) using the NotI and XhoI restriction sites. Plasmids for mammalian cell expression of EPNs -01 through -51 were constructed and inserted into pCMV using the KpnI and XhoI restriction sites by Gibson Assembly32 using synthetic DNA (Gen9). The E. coli expression plasmid for EPN-01* was constructed by adding the N- and C-terminal functional elements to the I3-01 sequence9 by PCR and inserting it by Gibson Assembly into pET29b digested with NdeI and XhoI. Mutations were introduced by round-the-horn site-directed mutagenesis or PCR amplification followed by Gibson Assembly as indicated in Supplementary Table 3. All constructs were verified by sequencing. A comprehensive list of all plasmids and coding sequences sources is provided in Supplementary Table 3. All of the plasmids have been submitted to the Addgene repository (https://www.addgene.org/). A comprehensive list of all antibodies, sources and dilutions is provided in Supplementary Table 4.
Protein expression in E. coli and purification
Expression plasmids were transformed into BL21(DE3) E. coli cells, and cells were grown in LB medium supplemented with 50 mg/l kanamycin (Sigma) at 37 °C to an OD600 of 0.8. Protein expression was induced by addition of 0.5 mM isopropyl-thio-β-D-galactopyranoside (Sigma) and allowed to proceed for 3 h at 37 °C before cells were harvested by centrifugation.
For the EPN-01* protein shown in Extended Data Fig. 2c, cells from a 1 l expression culture were lysed by sonication in 20 ml of 50 mM Tris pH 8, 250 mM NaCl, 20 mM imidazole, 2.5 mM MgCl2, 0.5 mM CaCl2, 1 mM DTT, 1 mM phenylmethanesulfonyl fluoride (PMSF) supplemented with 20 mg DNase (Sigma) and 2 mg of RNase (Qiagen), and the lysates were clarified by centrifugation for 25 minutes at 51,000 × g, 4 °C. Ammonium sulfate was added to the clarified lysate to 60% saturation, incubated at room temperature for 15 min, and the precipitate pelleted by centrifugation for 15 minutes at 51,000 × g, 4 °C. The pelleted protein was resuspended in 20 ml of 25 mM Tris pH 8, 150 mM NaCl, 5 mM EDTA, 1 mM DTT and heated for 10 min at 75 °C. The solution was clarified by centrifugation for 15 minutes at 51,000 × g, 4 °C, filtered with a 0.45 μm filter (EMD Millipore), and concentrated using a Centricon concentrator (EMD Millipore). The protein was then purified using a Superose 6 10/300GL column in the same buffer, the fractions pertaining to the nanocage peak centred around 12 ml were pooled and concentrated, and the protein refractionated using the Superose 6 10/300GL column equilibrated in 25 mM Tris pH 8, 150 mM NaCl, 5 mM EDTA supplemented with 0.75% 3-[(3-cholamidopropyl)dimethylammonio]-1-propanesulfonate (CHAPS). Nanocage peak fractions were again pooled and concentrated, and protein concentration determined using the BCA assay (ThermoFisher).
The proteins shown in Extended Data Fig. 2a and 1b were purified using a combination of immobilized metal affinity chromatography (IMAC) and size exclusion chromatography using a Superose 6 10/300 GL column. E. coli cells were lysed by sonication in 25 mM TRIS pH 8.0, 250 mM NaCl, 1 mM DTT, 20 mM imidazole supplemented with 1 mM phenylmethanesulfonyl fluoride, and the lysates were cleared by centrifugation for 25 minutes at 51,000 × g, 4 °C and filtered through 0.22 μm filters (Millipore). The proteins were purified from the filtered supernatants by IMAC via linear gradient elution from HisTrap HP columns (GE Healthcare) using 25 mM TRIS pH 8.0, 250 mM NaCl, 1 mM DTT, 20 mM imidazole as running/wash buffer and 25 mM TRIS pH 8.0, 250 mM NaCl, 1 mM DTT, 500 mM imidazole as elution buffer. Elution fractions containing pure proteins of interest were pooled, concentrated using centrifugal filters (Sartorius Stedim Biotech), and further purified on a Superose 6 10/300 gel filtration column (GE Healthcare) using 25 mM TRIS pH 8.0, 150 mM NaCl, 1 mM DTT as running buffer.
Negative stain electron microscopy
For the negative stain EM image shown in Extended Data Fig. 2c, 6 μl of purified EPN-01* at 0.075 mg/ml were applied to glow discharged, carbon-coated 400-mesh copper grids (Ted Pella), washed with Milli-Q water and stained with 0.75% uranyl formate. Grids were visualized for assembly validation and optimized for data collection. Screening and sample optimization was performed on a 100 kV Morgagni M268 transmission electron microscope (FEI) equipped with an Orius charge-coupled device (CCD) camera (Gatan). The final image was recorded on a 120 kV Tecnai G2 Spirit transmission electron microscope (FEI) using an Ultrascan 4000 4k × 4k CCD camera (Gatan) at 52,000 × magnification at the specimen level.
Mammalian cell culture
HeLa and HEK293T (293T) cells were obtained from ATCC and cultured in D-MEM (ThermoFisher) containing 10% FBS, penicillin (100 U/ml) and streptomycin (0.1 mg/ml), at 37 °C and 5% CO2. Expi293F (293F) cells, used to survey different EPN constructs, were obtained from ThermoFisher and cultured in 293F Expression Medium (ThermoFisher) containing penicillin (100 U/ml) and streptomycin (0.1 mg/ml), at 37 °C and 5% CO2 while shaking at 125 rpm. Cells were tested for mycoplasma contamination every 3 months using the MycoAlert™ Mycoplasma Detection Kit (Lonza).
EPN release assays
To assay EPN release as shown in Figs. 1, 4 and Extended Data Fig. 1, 8 × 10⁵ 293T cells were seeded in 6-well-plates 24 h prior to transfection. Cells were transfected with 2 μg of plasmid DNA expressing the I3-01- or O3-33-based EPN constructs, or co-transfected with 1 μg of plasmids expressing I3-01 based constructs and 1 μg of either pEGFP-VPS4A(E228Q) or pEGFP-C1 (Clonetech), using the polyethyleneimine (PEI, Polysciences, 3 μl of PEI/μg DNA) method. The medium was replaced with 1 ml growth medium 5 h later. Cells and culture supernatants were harvested 24 h post transfection. Released EPN assemblies were collected from the culture supernatants by centrifugation through a 200 μl 20% sucrose cushion for 90 min at 21,000 × g, 4 °C, and denatured by adding 50 μl 1 × Laemmli buffer and boiling for 5 min. Cells were lysed for 5 min on ice in 200 μl cold lysis buffer (50 mM Tris pH 7.4, 150 mM NaCl, 1% Triton X-100, protease inhibitors). Lysates were clarified by centrifugation for 5 min, 16,000 × g, 4 °C. The Triton-soluble fraction was treated with 200 μl 2 × Laemmli buffer supplemented with 10% 2-mercaptoethanol (Sigma) and boiled for 5 min. Triton-insoluble material was solubilized in 200 μl 2 × Laemmli buffer by boiling for 10 min. Samples containing EPN-51 and mutants thereof were incubated for 30 min at 40 °C instead of boiling because the protein aggregated at high temperatures. Benzonase (Sigma, 0.5 μl per sample) was added to remove nucleic acids from the Triton insoluble fractions. The Triton-soluble and -insoluble cellular fractions, and the released EPN complexes, were separated by 12.5% SDS-PAGE, transferred onto PVDF membranes (or nitrocellulose membranes in case of EPN-51 constructs), and probed with antibodies against the Myc epitope (primary antibodies and dilutions are provided in Supplementary Table 4). GAPDH was used as a loading control. Bands were visualized by probing the membrane with fluorescently labelled secondary antibodies (Li-Cor Biosciences) and scanning with an Odyssey Imager (Li-Cor Biosciences). Levels of expressed and released Myc-tagged EPN proteins were quantified by Western blot densitometry with ImageJ33 using standard curves generated with known quantities of recombinant EPN-01* protein produced in E. coli. Release efficiencies are reported as the percentage of EPN protein pelleted from the supernatant vs. the total protein in cells and pelleted supernatant. All experiments were repeated independently at least twice. Standard deviations shown in all figures were calculated from three technical repeats (three transfections in parallel) of each experiment.
EPN purification
Released EPNs used in immunoprecipitation and cryo-EM studies were purified from culture supernatants of 293T cells (2 × 10⁶ per 10 cm plate, 7 plates per specimen for the experiments shown in Fig. 2b and Extended Data Fig. 3d, 36 plates for the experiments shown in Figs. 2c and 2e and Extended Data Fig. 3a, seeded 24 h prior to transfection) after transient transfection with plasmids encoding EPN-01 or EPN-01* (12 μg/plate) using the calcium phosphate method (Clontech Laboratories). Transfected cells were incubated overnight and the media was replaced with exosome production media (D-MEM supplemented with 10% FBS, depleted of contaminating extracellular particles by centrifugation overnight at 100,000 × g at 4 °C and subsequently filtered through a 0.22 μm filter)34. Cells were grown for an additional 24 h and extracellular EPN assemblies were purified by a series of filtering and centrifugation steps (adapted from ref. 34). Briefly, cell debris was removed by centrifugation of the supernatant at 1,000 × g for 5 min followed by filtration through a 0.22 μm filter (EMD Millipore). EPN assemblies were collected by centrifugation at 100,000 × g in an SW32Ti (BeckmanCoulter) at 4 °C for 1 h. Pellets were resuspended in PBS and pooled in one tube (SW41 rotor, BeckmanCoulter). PBS was added to fill the tube completely and EPN assemblies were collected by centrifugation at 100,000 × g at 4 °C for 1 h. Pellets were resuspended in 1 ml of PBS and concentrated by centrifugation at 100,000 × g at 4 °C for 1 h in an OptimaMAX-E (BeckmanCoulter) benchtop ultracentrifuge using a TLS-55 rotor. EPNs were quantified by western blotting as described above. Typical yields were 2 - 8 μg EPN-01 and EPN-01* proteins from 36 × 10 cm dishes.
Preparation of EPNs -01 through -51 for protease protection and enzyme assays
EPNs for protease protection and aldolase activity assays as shown in Fig. 2a, and Extended Data Figs. 3b and 8 were prepared as follows. On the day of transfection, 293F cell count and viability were determined using trypan blue solution in a haemocytometer. The cells were plated in 1 ml volumes at 2.5 × 10⁶ cells per ml on non-TC treated 12-well plates (Corning). The cells were transfected with 1 μg of plasmid DNA using Expifectamine transfection reagent (ThermoFisher) following the manufacturer’s instructions. 18 h post-transfection, a cocktail of Expifectamine 293F Transfection Enhancer1 and Enhancer2 (ThermoFisher) was added to each well following manufacturer’s instructions. Cells and cultured supernatants were harvested 44 h post transfection and separated by centrifugation for 5 min at 1000 × g, 4 °C. The culture supernatants were filtered through a 0.45 μm filter (EMD Millipore) into a 1.5 ml microfuge tube. Released EPN assemblies were collected from the culture supernatants by centrifugation through 200 μl of a 20% sucrose cushion for 120 min at 21,000 × g, 4 °C and resuspended in PBS.
Protease protection assays
Purified EPNs were resuspended and incubated under three different conditions, 10 μl each: untreated EPN, EPN + 0.05 mg/ml trypsin, and EPN + 0.05 mg/ml trypsin + 1% Triton X-100. Samples were incubated for 30 min at 25 °C and then 1 mM PMSF was added and incubated for 10 min at 25 °C to inactivate trypsin. Samples were denatured by boiling for 10 min in 4 × Laemmli buffer supplemented with 5% 2-mercaptoethanol (except samples with the O3-33 domain, which were not boiled). All fractions were separated by SDS-PAGE, transferred onto Nitrocellulose membranes, and analysed by western blot using an anti-Myc antibody (Supplemental Table S4). Western blots were imaged using HRP-conjugated secondary antibodies (Cell Signaling Technology) and Clarity Western ECL Blotting Substrate (Bio-Rad). At least three biological replicates of the protease protection assay (independent transfections or batches of E. coli purified EPN-01*) were performed for each construct described in Extended Data Fig. 8 and Supplementary Table 1.
Aldolase enzyme activity assays
2-keto-3-deoxy-6-phosphogluconate (KDPG) aldolase activity of the I3-01 domain was monitored using a L-lactic acid dehydrogenase (LDH)-coupled assay35. 95 μl samples of assay solutions containing 25 mM HEPES pH 7.0, 20 mM NaCl, 0.1 mM NADH, 0.11 U/μl LDH, 1 mM KDPG, and either including or omitting 1% Triton X-100, were mixed with 5 μl of resuspended EPNs. Loss of absorbance at 339 nm due to oxidation of NADH was monitored using a SpectraMax M3 plate reader. At least three biological replicates of the aldolase activity assay (independent transfections or batches of E. coli purified EPN-01*) were performed for each construct described in Extended Data Fig. 8 and Supplementary Table 1.
EPN immunoprecipitation assays
1 μg of purified EPN-01 expressed in either bacteria or harvested from 293T supernatants was incubated in 250 μl PBS buffer containing either 0.1% or 0.5% CHAPS detergent for 20 min. EPN-01 assemblies were immunoprecipitated by addition of 30 μl of the indicated antibodies coupled to agarose resin and incubated for 14 h at 4 °C on a rotating shaker. Antibody-bound resins were: anti-rabbit-IgG-Agarose (Sigma) and anti-c-Myc-Agarose (Sigma). Resins were washed 6 × at 4 °C with 1 ml PBS/0.1 % CHAPS buffers and resuspended in 250 μl in 1 × Laemmli buffer containing 10 % 2-mercaptoethanol, boiled for 5 min, and analysed by western blotting.
Cryo-EM tomographic imaging of EPNs
To prepare samples for cryo-EM tomography, 3 μl of purified EPNs in PBS (50 ng EPN-01/μl as determined by western blotting vs. a standard curve) were mixed with 3 μl of BSA-coated gold fiducials (10 nm size, Electron Microscopy Sciences). 3.5 μl of the suspension were applied to a glow-discharged R2/2 holey carbon coated EM grid (Quantifoil) within the environmental chamber of a Vitrobot Mark I (FEI) maintained at 4 °C, 80% relative humidity. Excess liquid was blotted for 7.5 s (0 mm offset) from the grids with filter paper (Whatman) before plunge freezing in liquid ethane. Cryo-grids were placed in a Gatan 626 cryoholder (Gatan) and imaged in a 200 kV Tecnai TF20 microscope (FEI) equipped with a K2 summit direct electron detector (Gatan). Tilt series were recorded bidirectionally starting from 0° to ± ~ 60° with a 1° step size at a magnification of 22,500 × and a defocus of −8 μm (total dose per specimen ~ 300 e-/Å2) using low-dose mode in SerialEM36. Tomograms were generated using the IMOD software package37. Image stacks were aligned, binned by 4 and gold particles were erased using findbeads3d within IMOD. Aligned image stacks were Fourier filtered (cutoff 0.25, sigma 0.08) and tomographic reconstructions were performed using the simultaneous reconstruction technique (SIRT). Noise reduction was performed with the non-linear anisotropic diffusion (NAD) method in IMOD37, using a K value of 0.04 with 12 iterations. Segmentation and isosurface rendering was done using Amira (Version 4.1.2, FEI). Individual particles that could be completely traced along slices though the z-axis were manually identified and surrounded by a mask. The space inside the mask was then segmented and an isosurface was generated. Video segments were created in Amira and ffmpeg (ffmpeg.org) was used to combine segments and generate the H.264 encoded Supplementary Video 1.
Cryo-EM imaging and reconstruction of EPN-01* nanocages
4 μg of EPNs in PBS purified as described in EPN purification were incubated with 0.75% CHAPS for 20 min at 4 °C (20 μl total volume). 3.5 μl samples were placed on glow discharged R2/2 holey carbon grids (Quantifoil) within the Vitrobot environmental chamber (maintained at 4 °C, 80 % relative humidity), blotted for 11 s (0 mm offset) with filter paper, and plunge frozen in liquid ethane. Cryo-grids were imaged with a TF20 microscope operated at 200 kV (42,000 × magnification and −0.7 to −3.3 μm defocus). Images were recorded on a Gatan K2 Summit direct electron detector. SerialEM36 was used to facilitate low-dose imaging and semi-automated data collection, and 60 frames were recorded of each view in super-resolution mode. Frames were aligned and summed by using MotionCor238.
Three-dimensional images were reconstructed via routines implemented in the package SCIPION (scipion.cnb.csic.es). Contrast transfer function (CTF) parameters were determined using CTFFIND439. Particle images were selected and extracted using Xmipp40–42. Non-dose-weighted image sums from MotionCor2 were used for CTF determination and particle picking, with dose-weighted image sums used for all other steps. Extracted two-dimensional particle images were processed and then classified with the RELION software package43. Suitable two-dimensional class averages were used to determine an ab initio three-dimensional model via the program RANSAC44. This model was then used as the starting model for 3D image reconstruction via RELION with icosahedral symmetry applied during the 3D reconstruction calculations. The resulting 3D map was masked and a B-factor was applied (“post-processing”) via an automated procedure in RELION43,44. The final map was constructed from 8573 particles, and the resolution was determined to be 5.7 Å by the gold standard 0.143 criterion (Extended Data Fig. 4c). The design model9 was rigid-body fit into the completed 3D density, using UCSF Chimera45 to perform the fit and generate Supplementary Video 2. One additional residue (Lys1 of I3-01) was built into the density at the N-terminal end of the first helix of the I3-01 construct, and no additional density was visible for any of the remaining sequences outside the I3-01 domain. The resolution of the model/map fit was 7.1 Å (Fourier cross resolution 0.378 criterion46, see Extended Data Fig 4c).
Confocal immunofluorescence microscopy
For immunofluorescence imaging shown in Extended Data Fig. 5, 2 × 10⁵ HeLa cells were seeded onto coverslips in 12-well plates and transfected with plasmids encoding EPN proteins the next day. 24 h post-transfection, cells were fixed with 3.5% paraformaldehyde in PBS for 10 min at room temperature, washed twice in PBS, blocked and permeabilised in a block/perm solution (0.1% Triton X-100, 3% BSA in PBS) for 10 min before primary anti-Myc antibodies were added (1 μg/ml in block/perm solution) and incubated for 1 h at room temperature. Cells were washed 3 × for 10 min in wash buffer (0.1% Triton X-100 in PBS), and Alexa488 labelled secondary anti-mouse IgG antibody was added (ThermoFisher, 2 μg/ml in block/perm solution) and incubated for 1 h at room temperature. Nuclei and actin were stained by incubating cells with Hoechst 33342 (ThermoFisher, 1:10,000) and Phalloidin 647 (ThermoFisher, 1:40) in block/perm solution for 15 min. Cells were washed 4 × in wash buffer, and 2× in PBS before mounting onto glass coverslips (Flouromount-G, Southern Biotech). Confocal immunofluorescence images were acquired using NIS Elements software on a Nikon A1 microscope.
Immunogold labelling
For immunogold labelling experiments shown in Extended Data Fig. 6, 8 × 10⁵ 293T cells were seeded in 6-well plates 24 h prior to transfection (2 wells per sample). Cells were transfected with 2.5 μg of plasmid DNA expressing the EPN construct using Lipofectamine 2000TM (ThermoFisher) following the manufacturer’s instructions. 24 h post-transfection, the media was removed, cells were knocked loose and washed off the plate in fixative (2% PFA/0.1% glutaraldehyde in PBS), transferred to 1.5 ml test tubes and incubated on a rocker 16 h at 4 °C. Cells were then pelleted for 4 min at 16,000 × g and washed 4 × 5 min in 1 ml PBS and 2 × 5 min in 1 ml water on a rocker. Cell pellets were stained with 50 μl 2% uranyl acetate for 30 min and washed again 3 × for 5 min in 1 ml water. Samples were dehydrated in 1 ml of a graded series of ethanol in water (3 × 70 % ethanol, 3× 95 % ethanol, 3 × 100 % ethanol, 5 min each) and incubated 16 h in 1 ml of a 1:1 mixture ethanol:LR White resin (Sigma-Aldrich) at room temperature. Samples were then infiltrated by 2 × 6 h incubations in 1 ml 100% LR White, and the resin was polymerised at 50 °C overnight. Thin sections (80 nm, cut by a diamond knife (Diatome) in a Leica EM UC6 ultratome (Leica)) were mounted onto support specimen nickel grids (Electron Microscopy Sciences). For immunogold labelling, grids were hydrated on 100 μl drops of PBS for 10 min, and reactive aldehydes were then deactivated by incubating grids on 100 μl drops of 50 mM Glycine in PBS for 10 min. Grids were blocked for 1 h on 40 μl drops of blocking solution (5% BSA in PBS) and then incubated with primary anti-Myc antibodies (40 μl drops, 2 μg/ml in blocking solution) overnight at 4 °C in a moist chamber. The next day, grids were washed 3 × 5 min on 100 μl drops of blocking solution and probed on 40 μl drops of secondary anti-mouse IgG antibody labelled with 10 nm gold particles (Ted Pella, 1:100 in blocking solution) for 2 h at room temperature. Grids were then washed 3 × 5 min in blocking solution and 3 × 5 min in water, dried, and viewed on a JEOL JEM1400 electron microscope at an accelerating voltage of 120 kV.
To quantify immunogold staining, a region of interest was defined in ImageJ and particles were counted inside the defined area using the particle analyse function (see Extended Data Fig. 6 a–c, right panels)33.
EPN-01 delivery assays
The ability of EPNs to deliver packaged enzymes into the cytoplasms of recipient cells, as shown in Fig 3 and Extended Data Fig. 7, was evaluated using a modified version of the β-lactamase (BlaM) assay described previously15. 5 μg of a plasmid expressing an N-terminally Myc-tagged chimeric BlaM-Vpr fusion protein was co-transfected with 9 μg EPN-encoding plasmids and 1 μg of a plasmid encoding a C-terminally Myc-tagged VSV-G (Supplementary Table 3), in 10 cm plates using the Lipofectamine (ThermoFisher) method. Tranfection medium was replaced by 10 ml growth medium 5 h post transfection. EPNs containing VSV-G and BlaM-Vpr were harvested 36 h post transfection by centrifugation through 2 ml of a 20% sucrose cushion at 100,000 × g for 1 h at 4° C in a SW-41 rotor (BeckmanCoulter). Cellular and released proteins were separated on a 12.5 % SDS-PAGE and quantified by western blotting using an anti-Myc antibody, recombinant EPN-01 proteins. The internal volume of each protein nanocage is ~3,000 nm3 (ref. 9), which is sufficient to package ~60 close-packed BlaM-Vpr molecules, assuming that each BlaM-Vpr molecule is approximately 50 nm3. Quantification of western blot band intensities indicated that an average of ~10 BlaM-Vpr molecules were actually packaged by each 60-subunit EPN-01* nanocage.
For the BlaM delivery assay, 2 × 10⁵ HeLa cells/well were seeded in 24-well plates. 24 h later, the indicated EPN quantities were added to cultures and incubated for 2 h at 37 °C. EPN-containing supernatants were replaced by CCF2-AM labelling media, prepared according to the manufacturer’s instructions (ThermoFisher) using CO2-independent media (ThermoFisher) as the loading solution. Cells were labelled for 16 h at 13 °C and assayed by flow cytometry (FACSCanto, BD Biosciences) for changes in fluorescence emission spectrum from green (520 nm) to blue (447 nm). Data were collected with FACSDiva and analysed with FlowJo software (Treestar). Non-transduced cells treated with CCF2 were used to set the gate for uncleaved CCF2, which was set to discriminate transduced and non-transduced cells at a tolerance of >0.2% false positives (Extended Data Fig. 7d). Transduction assays were repeated independently at least three times (independent transfections). Standard deviations shown in Fig. 3 were calculated from three technical repeats of the BlaM delivery assay.
Data availability
Raw scans of all membranes and gels shown in the manuscript are included in this article as Supplementary Fig. 1. All other raw data are available from the corresponding authors N.P.K and W.I.S. upon request. EM charge density maps, model fitting, and supporting data have been deposited in the EMDataBank under the accession number EMD-8278, for release upon publication (http://www.emdatabank.org/). All novel plasmid constructs (Supplementary Information Table S3) have been submitted and are accessible to anyone through the Addgene plasmid repository (https://www.addgene.org/).
Extended Data
Extended Data Figure 1. EPN-01* is released from cells.
The EPN-01* constructs shown in this figure are analogous to the EPN-01 constructs shown in Fig. 1 except that EPN-01* ran as a doublet because a methionine codon at I3-01 position 3 (isoleucine in EPN-01) served as a second translation initiation codon. Panel 1 is a western blot showing functional and mutant EPN-01* proteins harvested from 293T cell culture supernatants. Panels 2 and 3 are western blots showing cellular EPN-01* proteins in the Triton-insoluble fraction (stably bound to membranes) and the Triton-soluble fraction (cytoplasm and weakly bound to membranes), respectively. Panel 4 is a western blot showing a GAPDH loading control from the Triton-soluble fraction. Below, the percentage of each protein released into the supernatant is plotted (error bars show standard deviation from three technical repetitions). In summary, EPN-01 and EPN-01* were functionally equivalent and were employed interchangeably in our studies. For western blot source data, see Supplementary Fig. 1.
Extended Data Figure 2. EPN-01* forms nanocages that resemble those of the I3-01 scaffold.
a, Size exclusion chromatograms (Superose 6 10/300 GL) of EPN-01*, EPN-01(ΔM), EPN-01(ΔL1+ΔL2), I3-01, and 1wa3-wt purified from E. coli. 1wa3-wt is the wild-type trimeric aldolase from which I3-01 was derived9. All of the proteins eluted as nanocages except for 1wa3-wt, which eluted at the volume expected for the trimer. b, SDS-PAGE of the peak fraction from each of the chromatograms in (a). Molecular weight marker positions are indicated in kilodaltons. c, Negative stain EM image of purified E. coli EPN-01*, showing a homogeneous field of particles (~25 nm diameter).
Extended Data Figure 3. EPN-01 constructs are released within membrane vesicles.
a, Detergent-dependent antibody accessibility of EPN-01 protein released from mammalian cells. Western blots of EPN-01 harvested from mammalian cell supernatants (Panels 1 and 2) or non-enveloped EPN-01* nanocages purified from E. coli (Panels 3 and 4) are shown. Samples were treated with 0.1% (Panels 1 and 3) or 0.5% CHAPS (Panel 2 and 4). Lane 1 shows input protein, and lanes 2–5 show bound and unbound fractions from immunoprecipitations with anti-Myc-Agarose (lanes 2 and 3) or control anti-rabbit-IgG-Agarose (lanes 4 and 5). b, Detergent-dependent aldolase substrate accessibility of EPN-01* protein released from mammalian cells. EPN-01* produced in 293F cells (top) or E. coli (bottom) were monitored for KPDG aldolase activity in the presence or absence of detergent. Note that the protein produced in mammalian cells only shows enzymatic activity in the presence of detergent, whereas the bacterially produced protein is equally active in both conditions. c, Size distribution of EPNs released into the culture supernatants of 293T cells expressing EPN-01*. n = 142 EPNs total, mean size = 107 ± 44. d, EPN-01* and associated cellular proteins are released from 293T cells. Western blots showing levels of I3-01-Myc, EPN-01*, ALIX, and actin expressed in 293T cells (left) and released into the culture supernatant (right). e, Numbers of EPN-01* protein nanocages encapsulated within six different EPN-01* vesicles of varying sizes. Nanocage numbers were determined by visual counting of reconstructed EPNs from cryo-tomographic tilt series. An average EPN vesicle of diameter 110 nm has a volume of 7 × 10⁵ nm3 and each nanocage has an estimated volume of ~8 × 10³ nm3. A 110 nm diameter vesicle could therefore theoretically contain as many as 90 close-packed nanocages, but they actually contain, on average, ~14 nanocages.
Extended Data Figure 4. EPN-01* protein released from 293T cells assembles into nanocages that closely correspond to the designed I3-01 structure.
a, Cryo-EM image of extracellular EPN-01* nanocages released from vesicles by CHAPS detergent treatment. b, Cryo-EM 2D class averages showing the ten most prevalent classes, together with the numbers of particles that comprise each class. c, Fourier shell correlations between the two half model charge density maps unmasked (blue curve) and masked (magenta curve). Orange curve shows Fourier shell correlations between the final charge density model and the I3-01 design model (with an additional residue built into the N terminus).
Extended Data Figure 5. Intracellular localisation of EPN-01 and EPN-18.
a, Confocal fluorescence images of HeLa cells transfected with EPN-01 (left) and EPN-01(ΔM) (right) stained for Myc (green), DNA (blue) and actin (red). Note that EPN-01 is localised primarily in intracellular compartments and also at the plasma membrane (white arrow), whereas EPN-01(ΔM) is cytoplasmic. b, Confocal fluorescence images of HeLa cells transfected with EPN-18 (left) and EPN-18(ΔM) (right). Note that EPN-18 is predominantly localised at the plasma membrane (white arrow), whereas EPN-18(ΔM) concentrates at internal puncta.
Extended Data Figure 6. Intracellular localisation and extracellular release of EPN-01.
a, Immunogold labelling of thin sections from 293T cells expressing EPN-01. Right image shows the boundaries of plasma membrane (cyan), cytosolic (black) and intracellular compartments (red) used for quantification (see panel d). b, Immunogold labelling of thin sections from 293T cells expressing EPN-01(ΔM). Right image shows the boundaries used for quantification, color-coded as in (a), except that intracellular compartment(s) could not be identified in this case because the EPN-01(ΔM) mutant does not localize there. c, Immunogold labelling of thin sections from 293T cells expressing EPN-01 showing budding and released EPNs. Right image shows the boundaries used for quantification as in (a) plus boundaries to quantify gold particle densities in released EPNs (green). Image to the left shows a expanded view of two EPNs that appear to be budding from the plasma membrane. e, Image quantification confirmed that EPN-01 is enriched at the plasma membrane, within intracellular compartments, and in released EPNs. The P-value comparing values for plasma membrane localisation of EPN-01 and EPN-01(ΔM) is 7 × 10⁻⁵ (unpaired t-test, n=11 images for EPN-01 and n=9 images for EPN-01(ΔM)).
Extended Data Figure 7. EPNs can package biological cargoes and deliver them to the cytoplasm of target HeLa cells.
a, Schematic illustration showing the production, assembly, and release of EPNs incorporating BlaM-Vpr and VSV-G proteins (left), and detection of uptake and target cell membrane fusion using a BlaM colorimetric activity assay (right). b, Co-expression of VSV-G increases the number of vesicles that contain spikes, as evaluated by scoring >140 vesicles as either “containing” or “not containing” surface spikes (images like the one shown in the inset of Fig. 3b were scored independently by two different people, one blinded, and their counts were averaged). c, Western blots showing cellular expression and release of EPN-01 and Myc-tagged GFP constructs with or without fused Vpr (see Supplementary Table 3 for sequence information). Panel 1 shows released protein, panel 2 and 3 expression of Myc-tagged proteins and GAPDH in whole cell lysates. Lane 1 shows co-expression of EPN-01 with Myc-GFP-Vpr, lane 2 shows co-expression of EPN-01 with Myc-GFP. d, Flow cytometric analyses of HeLa cells loaded with the fluorescent CCF2 β-lactamase substrate and incubated with increasing quantities of wild-type EPN-01*/VSV-G/BlaM-Vpr (row 1), EPN-01*/VSV-G(P127D) mutant/BlaM-Vpr (row 2), and EPN-01*(LF45AA) mutant/VSV-G/BlaM-Vpr (row 3).
Extended Data Figure 8. Aldolase and protease protection assays for EPNs with a variety of functional elements and protein architectures.
Schematic illustrations and analyses of the 16 EPN constructs that yielded robust EPN biogenesis are shown, as well as one negative control. Each panel shows the construct, a representative plot of aldolase activity in the presence (black line) and absence (grey line) of detergent, and a western blot analysis of the protease protection assay. Arrowheads next to each blot denote the full-length protein. Aldolase activity was monitored by disappearance of absorbance at 339 nm. a, Different membrane-binding elements support EPN formation. b, EPN-02, also referred to as EPN-01(ΔM), is a negative control construct in which the myristoylation site was inactivated by mutation. Both assays reveal that EPN-02 protein was not released from cells. c, EPN-51, which uses the designed 24-subunit protein assembly O3-33 as a self-assembly domain, forms an EPN with an intact membrane envelope. The aldolase assay was not included because O3-33 is not an aldolase. d, Different ESCRT-recruiting elements can support EPN formation. The asterisk next to the blot of EPN-36 signifies that the blot was overexposed: EPN-36 reproducibly yielded fainter bands on western blots than would be expected based on its aldolase activity and analyses of SDS-PAGE gels stained with Coomassie. e, Membrane-binding, self-assembly, and ESCRT-recruiting elements can function from different positions within EPN constructs. EPN-11 is a permutation of EPN-07, while EPN-23, EPN-24, and EPN-25 are permutations of EPN-18.
Supplementary Material
Acknowledgments
This work was supported in part by Deutsche Forschungsgemeinschaft (DFG) Fellowship VO 1836/1-1 (to J.V.), an NIH Molecular Biology Training Grant (T32GM008268) (Y.H.), a PHS National Research Service Award (T32GM007270) from NIGMS (U.N.), grants from the Bill & Melinda Gates Foundation (OPP1118840) and Defense Advanced Research Projects Agency (W911NF-14-1-0162) (N.P.K.), and NIH grants RO1 AI 51174 and P50 082545 (W.I.S.). We thank Peter Shen and John McCullough for assistance and advice on cryo-EM experiments, Stephen Carter and Shrawan Magesrawan (Caltech) for assistance with Amira Software, Linda Nikolova (University of Utah EM Core) for assistance with immunogold labelling experiments, Michael Redd (University of Utah Cell Imaging Core) for assistance with confocal microscopy, Adam Wargacki for cloning assistance, Stephen Hauschka for tissue culture assistance, and Marc Lajoie, Lance Stewart, and David Baker for helpful discussions.
Footnotes
Author Contributions:
J.V., N.P.K., and W.I.S. designed and coordinated the study. J.V. performed EPN and cellular protein release assays, IP assays, BlaM delivery assays, confocal fluorescence microscopy, and immunogold EM. J.V. and D.M.B. performed cryo-electron microscopy and tomography, including single-particle reconstruction. C.O. and S.Y. designed EPN constructs and produced, purified, and analysed EPN proteins expressed in E. coli. C.O. performed EPN release assays, protease protection assays, and aldolase assays. Y.H. performed aldolase assays and purified I3-01 from E. coli. U.N. performed negative stain EM on proteins purified from E. coli. J.V., C.O., D.M.B., N.P.K., and W.I.S. interpreted data. J.V., N.P.K., and W.I.S. wrote the manuscript.
Competing Financial Interests:
J.V., Y.H., N.P.K., and W.I.S. co-authored a US patent application (62/126,331) with claims relating to Enveloped Protein Nanocages through the CoMotion office at the University of Washington. The authors declare no other competing financial interests.
References
- 1.Rothemund PW. Folding DNA to create nanoscale shapes and patterns. Nature. 2006;440:297–302. doi: 10.1038/nature04586. [DOI] [PubMed] [Google Scholar]
- 2.Ke Y, Ong LL, Shih WM, Yin P. Three-dimensional structures self-assembled from DNA bricks. Science. 2012;338:1177–1183. doi: 10.1126/science.1227268. [DOI] [PMC free article] [PubMed] [Google Scholar]
- 3.King NP, et al. Computational design of self-assembling protein nanomaterials with atomic level accuracy. Science. 2012;336:1171–1174. doi: 10.1126/science.1219364. [DOI] [PMC free article] [PubMed] [Google Scholar]
- 4.Suzuki Y, et al. Self-assembly of coherently dynamic, auxetic, two-dimensional protein crystals. Nature. 2016;533:369–373. doi: 10.1038/nature17633. [DOI] [PMC free article] [PubMed] [Google Scholar]
- 5.Lai YT, et al. Structure of a designed protein cage that self-assembles into a highly porous cube. Nat Chem. 2014;6:1065–1071. doi: 10.1038/nchem.2107. [DOI] [PMC free article] [PubMed] [Google Scholar]
- 6.Mou Y, Yu JY, Wannier TM, Guo CL, Mayo SL. Computational design of co-assembling protein-DNA nanowires. Nature. 2015;525:230–233. doi: 10.1038/nature14874. [DOI] [PubMed] [Google Scholar]
- 7.Delebecque CJ, Lindner AB, Silver PA, Aldaye FA. Organization of intracellular reactions with rationally designed RNA assemblies. Science. 2011;333:470–474. doi: 10.1126/science.1206938. [DOI] [PubMed] [Google Scholar]
- 8.Votteler J, Sundquist WI. Virus budding and the ESCRT pathway. Cell Host Microbe. 2013;14:232–241. doi: 10.1016/j.chom.2013.08.012. [DOI] [PMC free article] [PubMed] [Google Scholar]
- 9.Hsia Y, et al. Design of a hyperstable 60-subunit protein icosahedron. Nature. 2016;535:136–139. doi: 10.1038/nature18010. [DOI] [PMC free article] [PubMed] [Google Scholar]
- 10.Wills JW, Craven RC. Form, function, and use of retroviral gag proteins. AIDS. 1991;5:639–654. doi: 10.1097/00002030-199106000-00002. [DOI] [PubMed] [Google Scholar]
- 11.Weissenhorn W, Poudevigne E, Effantin G, Bassereau P. How to get out: ssRNA enveloped viruses and membrane fission. Curr Opin Virol. 2013;3:159–167. doi: 10.1016/j.coviro.2013.03.011. [DOI] [PMC free article] [PubMed] [Google Scholar]
- 12.Göttlinger HG, Sodroski JG, Haseltine WA. Role of capsid precursor processing and myristoylation in morphogenesis and infectivity of human immunodeficiency virus type 1. Proc Natl Acad Sci USA. 1989;86:5781–5785. doi: 10.1073/pnas.86.15.5781. [DOI] [PMC free article] [PubMed] [Google Scholar]
- 13.Choi DS, Kim DK, Kim YK, Gho YS. Proteomics, transcriptomics and lipidomics of exosomes and ectosomes. Proteomics. 2013;13:1554–1571. doi: 10.1002/pmic.201200329. [DOI] [PubMed] [Google Scholar]
- 14.Chertova E, et al. Proteomic and biochemical analysis of purified human immunodeficiency virus type 1 produced from infected monocyte-derived macrophages. J Virol. 2006;80:9039–9052. doi: 10.1128/JVI.01013-06. [DOI] [PMC free article] [PubMed] [Google Scholar]
- 15.Cavrois M, De Noronha C, Greene WC. A sensitive and specific enzyme-based assay detecting HIV-1 virion fusion in primary T lymphocytes. Nature biotechnology. 2002;20:1151–1154. doi: 10.1038/nbt745. [DOI] [PubMed] [Google Scholar]
- 16.Tobiume M, Lineberger JE, Lundquist CA, Miller MD, Aiken C. Nef does not affect the efficiency of human immunodeficiency virus type 1 fusion with target cells. J Virol. 2003;77:10645–10650. doi: 10.1128/JVI.77.19.10645-10650.2003. [DOI] [PMC free article] [PubMed] [Google Scholar]
- 17.Kondo E, Göttlinger HG. A conserved LXXLF sequence is the major determinant in p6gag required for the incorporation of human immunodeficiency virus type 1 Vpr. J Virol. 1996;70:159–164. doi: 10.1128/jvi.70.1.159-164.1996. [DOI] [PMC free article] [PubMed] [Google Scholar]
- 18.Fredericksen BL, Whitt MA. Vesicular stomatitis virus glycoprotein mutations that affect membrane fusion activity and abolish virus infectivity. J Virol. 1995;69:1435–1443. doi: 10.1128/jvi.69.3.1435-1443.1995. [DOI] [PMC free article] [PubMed] [Google Scholar]
- 19.Strack B, Calistri A, Craig S, Popova E, Göttlinger HG. AIP1/ALIX is a binding partner for HIV-1 p6 and EIAV p9 functioning in virus budding. Cell. 2003;114:689–699. doi: 10.1016/s0092-8674(03)00653-6. [DOI] [PubMed] [Google Scholar]
- 20.Martin-Serrano J, Zang T, Bieniasz PD. HIV-1 and Ebola virus encode small peptide motifs that recruit Tsg101 to sites of particle assembly to facilitate egress. Nature medicine. 2001;7:1313–1319. doi: 10.1038/nm1201-1313. [DOI] [PubMed] [Google Scholar]
- 21.Monroe N, Hill CP. Meiotic Clade AAA ATPases: Protein Polymer Disassembly Machines. J Mol Biol. 2016;428:1897–1911. doi: 10.1016/j.jmb.2015.11.004. [DOI] [PMC free article] [PubMed] [Google Scholar]
- 22.Parent LJ, et al. Positionally independent and exchangeable late budding functions of the Rous sarcoma virus and human immunodeficiency virus Gag proteins. J Virol. 1995;69:5455–5460. doi: 10.1128/jvi.69.9.5455-5460.1995. [DOI] [PMC free article] [PubMed] [Google Scholar]
- 23.Frank GA, et al. Maturation of the HIV-1 core by a non-diffusional phase transition. Nature communications. 2015;6:5854. doi: 10.1038/ncomms6854. [DOI] [PMC free article] [PubMed] [Google Scholar]
- 24.Wang X, et al. Hepatitis A virus and the origins of picornaviruses. Nature. 2015;517:85–88. doi: 10.1038/nature13806. [DOI] [PMC free article] [PubMed] [Google Scholar]
- 25.Feng Z, et al. A pathogenic picornavirus acquires an envelope by hijacking cellular membranes. Nature. 2013;496:367–371. doi: 10.1038/nature12029. [DOI] [PMC free article] [PubMed] [Google Scholar]
- 26.Reynwar BJ, et al. Aggregation and vesiculation of membrane proteins by curvature-mediated interactions. Nature. 2007;447:461–464. doi: 10.1038/nature05840. [DOI] [PubMed] [Google Scholar]
- 27.Perrault SD, Shih WM. Virus-inspired membrane encapsulation of DNA nanostructures to achieve in vivo stability. ACS nano. 2014;8:5132–5140. doi: 10.1021/nn5011914. [DOI] [PMC free article] [PubMed] [Google Scholar]
- 28.Hu CM, et al. Nanoparticle biointerfacing by platelet membrane cloaking. Nature. 2015;526:118–121. doi: 10.1038/nature15373. [DOI] [PMC free article] [PubMed] [Google Scholar]
- 29.Andaloussi SEL, Mäger I, Breakefield XO, Wood MJA. Extracellular vesicles: biology and emerging therapeutic opportunities. Nature Reviews Drug Discovery. 2013;12:347–357. doi: 10.1038/nrd3978. [DOI] [PubMed] [Google Scholar]
- 30.György B, Hung ME, Breakefield XO, Leonard JN. Therapeutic Applications of Extracellular Vesicles: Clinical Promise and Open Questions. Annual review of pharmacology and toxicology. 2015;55:439–464. doi: 10.1146/annurev-pharmtox-010814-124630. [DOI] [PMC free article] [PubMed] [Google Scholar]
- 31.Morita E, Arii J, Christensen D, Votteler J, Sundquist WI. Attenuated protein expression vectors for use in siRNA rescue experiments. Biotechniques. 2012;0:1–5. doi: 10.2144/000113909. [DOI] [PMC free article] [PubMed] [Google Scholar]
- 32.Gibson DG, et al. Enzymatic assembly of DNA molecules up to several hundred kilobases. Nat Methods. 2009;6:343–345. doi: 10.1038/nmeth.1318. [DOI] [PubMed] [Google Scholar]
- 33.Schneider CA, Rasband WS, Eliceiri KW. NIH Image to ImageJ: 25 years of image analysis. Nat Methods. 2012;9:671–675. doi: 10.1038/nmeth.2089. [DOI] [PMC free article] [PubMed] [Google Scholar]
- 34.Thery C, Amigorena S, Raposo G, Clayton A. Isolation and characterization of exosomes from cell culture supernatants and biological fluids. Curr Protoc Cell Biol. 2006;Chapter 3(Unit 3):22. doi: 10.1002/0471143030.cb0322s30. [DOI] [PubMed] [Google Scholar]
- 35.Griffiths JS, et al. Cloning, isolation and characterization of the Thermotoga maritima KDPG aldolase. Bioorg Med Chem. 2002;10:545–550. doi: 10.1016/s0968-0896(01)00307-8. [DOI] [PubMed] [Google Scholar]
- 36.Mastronarde DN. Automated electron microscope tomography using robust prediction of specimen movements. J Struct Biol. 2005;152:36–51. doi: 10.1016/j.jsb.2005.07.007. [DOI] [PubMed] [Google Scholar]
- 37.Kremer JR, Mastronarde DN, McIntosh JR. Computer Visualization of Three-Dimensional Image Data Using IMOD. J Struct Biol. 1996;116:71–76. doi: 10.1006/jsbi.1996.0013. [DOI] [PubMed] [Google Scholar]
- 38.Zheng SQ, Palovcak E, Armache J, Cheng Y, Agard DA. Anisotropic Correction of Beam-induced Motion for Improved Single-particle Electron Cryo-microscopy. Nat Methods. 2016 doi: 10.1038/nmeth.4193. Submitted. [DOI] [PMC free article] [PubMed] [Google Scholar]
- 39.Rohou A, Grigorieff N. CTFFIND4: Fast and accurate defocus estimation from electron micrographs. J Struct Biol. 2015;192:216–221. doi: 10.1016/j.jsb.2015.08.008. [DOI] [PMC free article] [PubMed] [Google Scholar]
- 40.Abrishami V, et al. A pattern matching approach to the automatic selection of particles from low-contrast electron micrographs. Bioinformatics. 2013;29:2460–2468. doi: 10.1093/bioinformatics/btt429. [DOI] [PubMed] [Google Scholar]
- 41.de la Rosa-Trevin JM, et al. Xmipp 3.0: an improved software suite for image processing in electron microscopy. J Struct Biol. 2013;184:321–328. doi: 10.1016/j.jsb.2013.09.015. [DOI] [PubMed] [Google Scholar]
- 42.Sorzano CO, et al. Semiautomatic, high-throughput, high-resolution protocol for three-dimensional reconstruction of single particles in electron microscopy. Methods Mol Biol. 2013;950:171–193. doi: 10.1007/978-1-62703-137-0_11. [DOI] [PubMed] [Google Scholar]
- 43.Scheres SH. RELION: implementation of a Bayesian approach to cryo-EM structure determination. J Struct Biol. 2012;180:519–530. doi: 10.1016/j.jsb.2012.09.006. [DOI] [PMC free article] [PubMed] [Google Scholar]
- 44.Vargas J, Alvarez-Cabrera AL, Marabini R, Carazo JM, Sorzano CO. Efficient initial volume determination from electron microscopy images of single particles. Bioinformatics. 2014;30:2891–2898. doi: 10.1093/bioinformatics/btu404. [DOI] [PubMed] [Google Scholar]
- 45.Pettersen EF, et al. UCSF Chimera--a visualization system for exploratory research and analysis. Journal of computational chemistry. 2004;25:1605–1612. doi: 10.1002/jcc.20084. [DOI] [PubMed] [Google Scholar]
- 46.Penczek PA. Resolution measures in molecular electron microscopy. Methods Enzymol. 2010;482:73–100. doi: 10.1016/S0076-6879(10)82003-8. [DOI] [PMC free article] [PubMed] [Google Scholar]
Associated Data
This section collects any data citations, data availability statements, or supplementary materials included in this article.
Supplementary Materials
Data Availability Statement
Raw scans of all membranes and gels shown in the manuscript are included in this article as Supplementary Fig. 1. All other raw data are available from the corresponding authors N.P.K and W.I.S. upon request. EM charge density maps, model fitting, and supporting data have been deposited in the EMDataBank under the accession number EMD-8278, for release upon publication (http://www.emdatabank.org/). All novel plasmid constructs (Supplementary Information Table S3) have been submitted and are accessible to anyone through the Addgene plasmid repository (https://www.addgene.org/).


