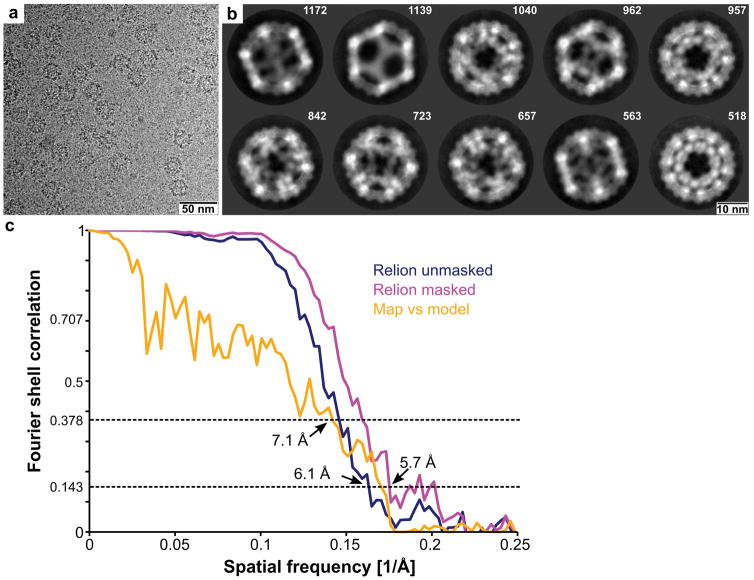
Extended Data Figure 4. EPN-01* protein released from 293T cells assembles into nanocages that closely correspond to the designed I3-01 structure.
a, Cryo-EM image of extracellular EPN-01* nanocages released from vesicles by CHAPS detergent treatment. b, Cryo-EM 2D class averages showing the ten most prevalent classes, together with the numbers of particles that comprise each class. c, Fourier shell correlations between the two half model charge density maps unmasked (blue curve) and masked (magenta curve). Orange curve shows Fourier shell correlations between the final charge density model and the I3-01 design model (with an additional residue built into the N terminus).

