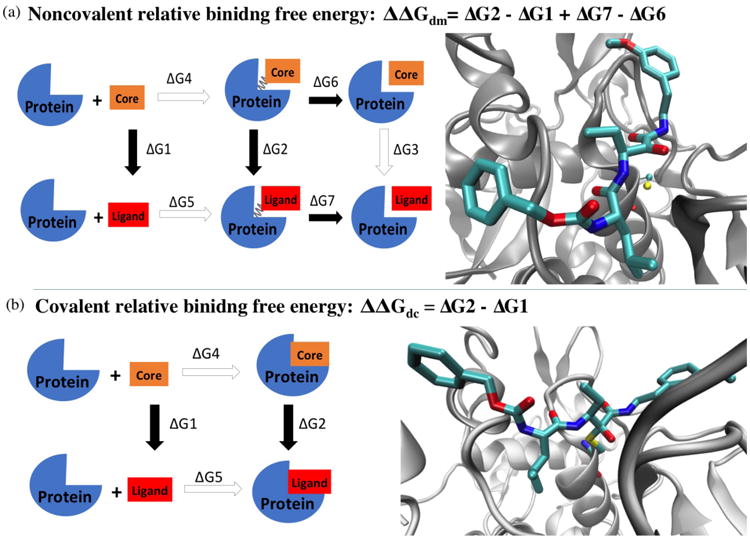
Figure 3. Thermodynamics cycle for calculating the relative binding free energy of the noncovalent (a) and covalent (b) states.

The structure on the right shows the scaffold of the binding complexes used for FEP/λ-REMD simulations. Protein backbones are shown in silver new cartoon mode. In noncovalent complex, the catalytic cysteine is shown in CPK mode with atom color code: yellow sulfur, red oxygen, blue nitrogen, and cyan carbon. Ligand 4 is shown in licorice mode with the same color code. In covalent complex, the catalytic cysteine is covalently linked to the ligand warhead. All hydrogen atoms are omitted for clarity.
