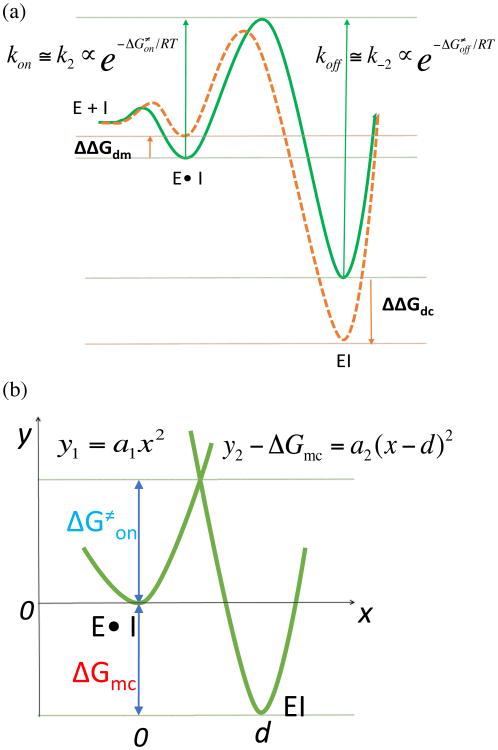
Figure 5. Relationship between the activation energy and the binding free energy.
(a) Hypothetical scenarios to reduce ΔG≠on: destabilizing the noncovalent-bound state and stabilizing the covalent-bound state. The green curve represents the free energy profile of a common core structure. The orange curve represents the free energy profile of an individual ligand. (b) The two-state potential surfaces are represented by two parabolas with different shapes.

