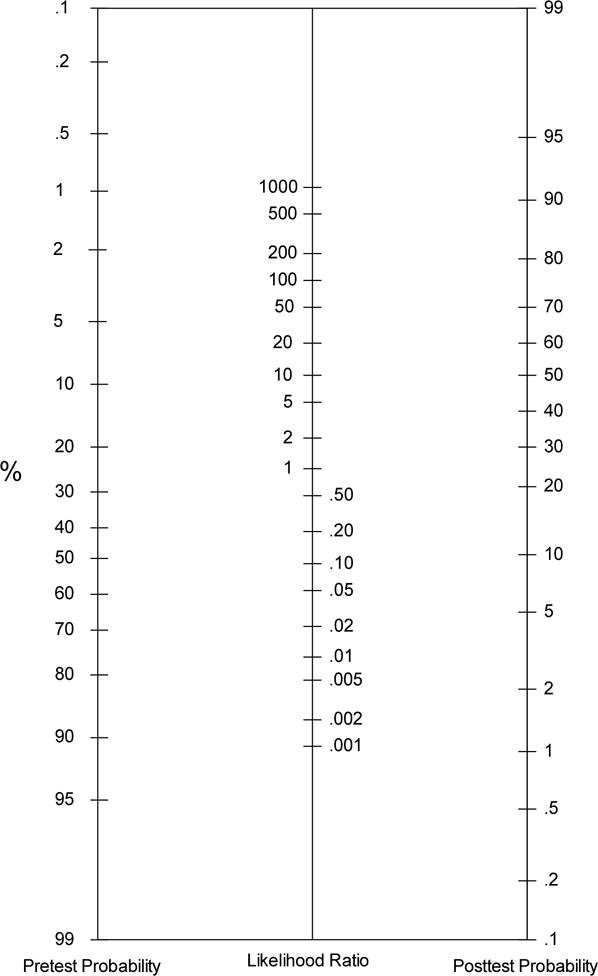
Figure 1.

Nomogram for integrating likelihood ratios to determine a posterior probability
Note: On the left side of the nomogram, the clinician would input the pretest probability – usually the base rate of the disorder under consideration – on the middle line, the likelihood ratio that corresponds with the first piece of clinical data (e.g., self report score, family history) is added. A line can then be drawn from the number on the pretest probability line through the likelihood ratio to the right side of the nomogram. The point at which the line intersects on the right side is the posttest probability – the new probability that the client has the disorder after integrating the base rate and one piece of clinical information. If there are additional pieces of information to add, the posttest probability becomes the new pretest probability, is moved to the left side, and the process begins again.
