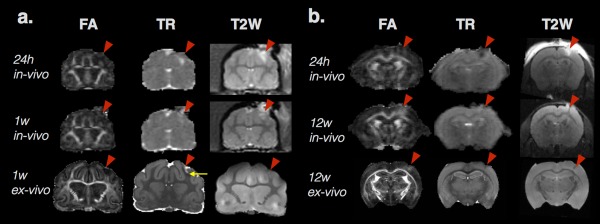
Figure 1.

Two examples of DTI metric abnormalities following experimental TBI in ferret (a) and mouse (b) brains. For each species, the in vivo and ex vivo FA and trace (TR) maps and T2‐weighted images are shown from the same animal after controlled cortical impact (CCI site indicated by red arrowhead). Several key features of diffusion changes after TBI are demonstrated in this figure including heterogeneity of diffusivity abnormalities within regions of edema shown by values of TR that are increased (a), decreased (b), or normal (a and b) within tissue regions with T2 hyperintensity. Distinct profiles of TR and FA can also be found in this figure by comparing images in the middle row where TR is relatively normal for both the ferret and mouse brains, but FA is decreased in the ferret brain white matter at 1 week (a) and increased in the mouse brain cortex at 12 weeks (b). By comparing the middle and last rows of in vivo and ex vivo maps from the same animal at the same time point, a distinct pattern can be found for the ferret brain at 1 week (a) in which subdomains of increased TR (near the red arrowhead) and decreased TR (yellow arrow) can be found in regions of unremarkable in vivo TR. In contrast, the same region of increased FA can be found in both the in vivo and ex vivo mouse brain 12 weeks after CCI (b). The observations depicted in this figure demonstrate several of the key points described in the text
