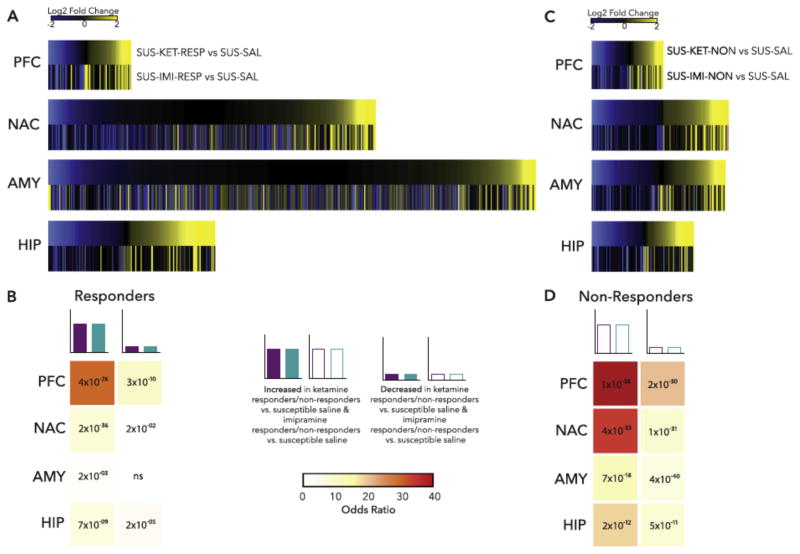
Figure 4.
Example of transcriptomic analysis of treatment response vs. non-response in a mouse model. Mice were subjected to chronic social defeat stress. Susceptible mice were treated with repeated imipramine or single dose ketamine and responders and non-responders were identified. Four brain regions were then subjected to RNA-seq. (A) Heatmaps show the union of ketamine response (SUS-KET-RESP vs. SUS-SAL) and imipramine response (SUS-IMI-RESP vs. SUS-SAL) differentially expressed genes (DEGs) rank ordered by log2 fold change of ketamine response and scaled by relative number of DEGs. (B) Table of p value (text) and odds ratio (warmer colors indicating increasing odds ratio) for Fisher’s exact test for enrichment of ketamine response DEGs in imipramine response DEGs. (C) Heatmaps show the union of ketamine nonresponse (SUS-KET-NON vs. SUS-SAL) and imipramine nonresponse (SUS-IMI-NON vs. SUS-SAL) DEGs rank ordered by log2 fold change of ketamine nonresponse and scaled by relative number of DEGs. (D) Table of p value (text) and odds ratio (warmer colors indicating increasing odds ratio) for Fisher’s exact test for enrichment of ketamine nonresponse DEGs in imipramine nonresponse DEGs. *p<0.05. AMY, amygdala; HIP, hippocampus; NAC, nucleus accumbens; ns, nonsignificant; PFC, prefrontal cortex. From Bagot et al., 2016b.

