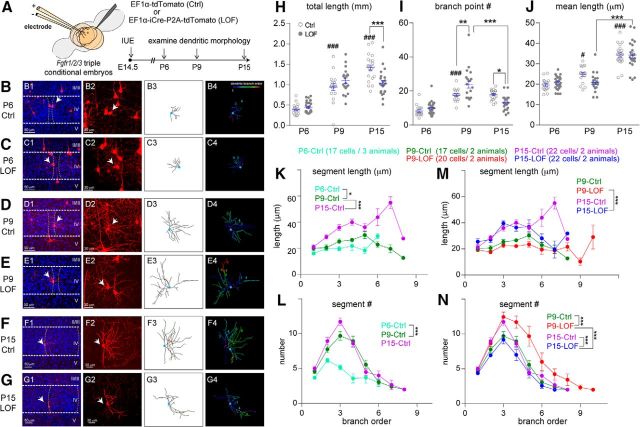
Figure 1.
Eliminating Fgfr1/2/3 perturbed activity-guided dendritogenesis processes in vivo. A, Schematic representation of experimental procedures. B–G, Examples of original images and computer-aided reconstructions. B1–G1 show the locations of barrels (dashed lines) and reconstructed neurons (white arrows). II–V, Cortical layers. The projected images from each confocal image stack are shown in B2–G2. B3–G3 show the traced images of neurons in B2–G2. B4–G4 show color-coded segments according to their branch orders. H–J, Quantitation of total length (H), branch points (I), and mean length (J) of dendrites. K–N, Summaries of segment length (K, M) and number (L, N) per branch order. Cell numbers and animal numbers for each group are as listed in the figure, and there are 28 cells/4 animals in the P6-LOF group. One-way ANOVA with post hoc Tukey's multiple-comparisons test was conducted for H to J. Two-way ANOVA with post hoc Tukey's multiple-comparisons test was conducted for K to N. The statistical analysis (#) compared the indicated groups with control (Ctrl) group with younger age: #p < 0.05; ###p < 0.001. The statistical analysis (*) compared the indicated groups: *p < 0.05; **p < 0.01; ***p < 0.001. Original data values and detailed statistical comparisons for this part of the figure are contained in extended data file Figure 1-1.

