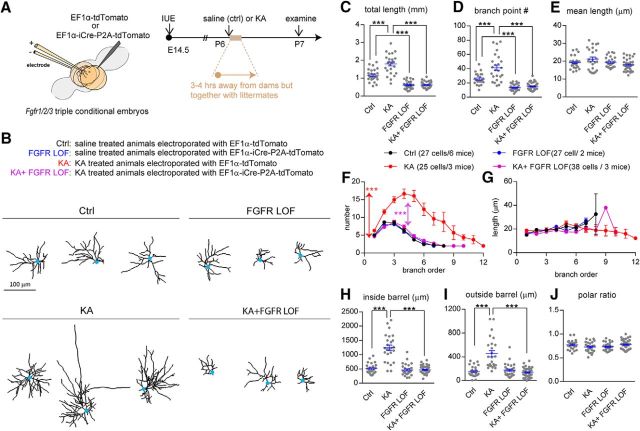
Figure 5.
KA treatment promoted bSC dendritogenesis within 24 h in an FGFR1/2/3-dependent manner. A, Schematic representation shows the experimental procedures and developmental stages for IUE and KA treatment. B, Examples of computer-aided reconstructions. C–E, The total dendritic length (C), branch point number (D), and mean dendritic length (E) are plotted. F, G, Summary of number (F) and length (G) per branch order. Two-way ANOVA with post hoc Tukey's multiple-comparisons test was conducted for F and G. The statistical analysis indicated by the red asterisk refers to the KA group compared with the control (Ctrl) group. The statistical analysis indicated by the purple asterisk refers to the KA+FGFR LOF group compared with the KA group: ***p < 0.001. H–J, Quantitative analysis of dendritic length inside (H) and outside (I) of the barrel that was used to calculate dendritic polarity (J). One-way ANOVA with post hoc Tukey's multiple-comparisons test was conducted for C–E and H–J. The statistical analysis compared the indicated groups: ***p < 0.001. Original data values and detailed statistical comparisons for this part of the figure are contained in extended data file Figure 5-1.

