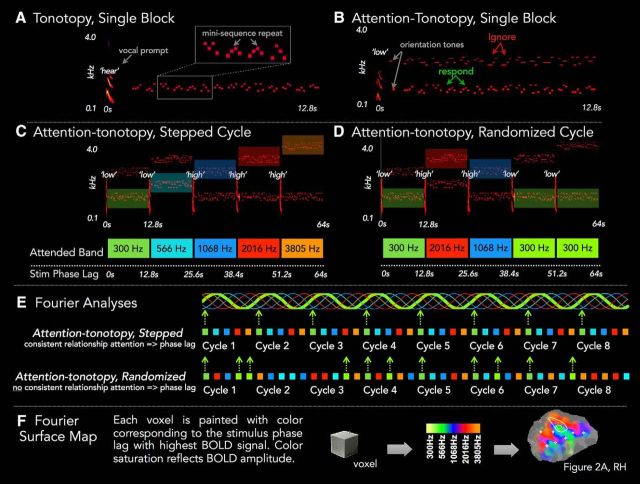
Figure 1.
Stimuli and design overview. A, In a representative 12.8 s Tonotopy block, a neutral verbal prompt “hear” precedes 14 four-tone mini-sequences sampled around one of five center frequencies. The task is to detect the 1–3 mini-sequence repeats embedded within the block. Gray box represents a single mini-sequence repeat. B, A single Attention-tonotopy (attn-tono) block includes two simultaneous streams of mini-sequences with distinct center frequencies. Mini-sequence repeats occur in each stream. A verbal prompt (“high” or “low”) directs listeners to attend to one stream and report mini-sequence repeats in that stream while ignoring repeats in the unattended stream. Two randomly ordered orientation tones at the center frequency of each stream alert listeners to the frequency neighborhood of the upcoming streams. C, A single 64 s cycle of stepped attn-tono blocks includes five 12.8 s blocks that step up (shown), or down, in center frequency. In this single cycle, the frequency band to which attention is directed by the verbal prompt (indicated with “high”/”low” above each block) is acoustically matched with the tonotopy cycle shown in B, but there are always competing unattended mini-sequences in a distinct frequency band. D, A single 64 s cycle of randomized attn-tono blocks is acoustically identical to the stepped attn-tono cycle in C, except that half of the verbal prompts have been swapped, and therefore no longer cue attention to frequency with consistent phase lags. E, The distinction between stepped and randomized attn-tono blocks is highlighted by examining the first three (of eight) cycles of a stepped (top) versus randomized (bottom) attn-tono run. The focus of attention is color coded in the frequency band-specific manner shown in A. Top, For the stepped condition, there is a consistent relationship between the stimulus phase lag and the attended frequency across cycles within a run. Thus, for voxels that show a consistently higher response at one attended frequency band compared with all others, there will be a periodic response at 8 cycles/run at a given phase lag corresponding to the particular frequency band attended. Bottom, For the randomized condition, there is no consistent relationship, providing a control condition for Fourier analyses because frequency band-directed attention is aperiodic across a run. F, The stimulus phase lag with the highest periodic BOLD signal amplitude is determined for each voxel, mapped to a color scale, and then painted onto the cortical surface patch. BOLD signal amplitude is mapped to the color's saturation. A–D, Stimulus intensity is adjusted across the spectrum to aid visual presentation of energy across frequency bands (for details on actual intensity across frequency bands, see Materials and Methods).

