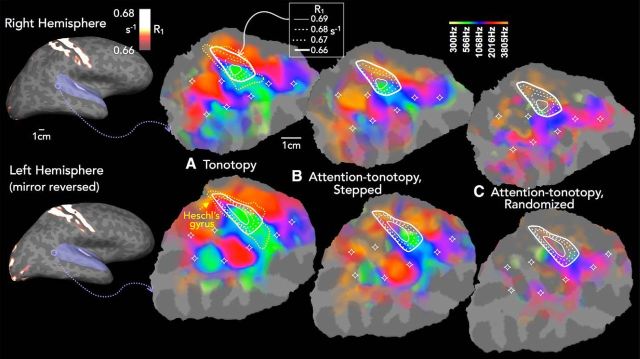
Figure 2.
Group activation for tonotopy and attn-tono conditions, with R1 contours showing putative auditory core. Leftmost panel, Cortical surface-based group-averaged R1, projected on the lateral inflated surface of one subject. The left hemisphere is mirror-reversed to align cortical maps for visual comparison. For tonotopic map display, a patch of cortex, including the entire temporal plane (shown in purple on the inflated surface), was cut and flattened. A–C, Enlarged region, with isocontour lines showing quantitative R1 values for the group-averaged putative auditory core and color maps showing group-averaged best frequency as a function of (A) tonotopy, (B) attn-tono (stepped), and (C) attn-tono (randomized control) conditions. Stars represent fiduciary points to assist in visual comparisons of maps across conditions. Yellow dashed lines indicate the outline of Heschl's gyrus (in A, from the individual subject whose cortical patch was used). Consistent with previous work, the tonotopic map is characterized by two pairs of three interlacing best-frequency fingers, with the high-frequency fingers (red/orange colormap) showing greatest frequency preference medially and extending laterally, where they meet interdigitated lower-frequency fingers (green/yellow colormap) extending lateral to medial, with the longest middle lower-frequency finger extending approximately halfway into auditory core. This pattern is evident in Fourier analysis-derived maps of the stepped attn-tono condition but not in the randomized control attn-tono condition, for which the attentional response was phase-cancelled. All maps are statistically masked by overall activation to tonotopy stimuli in each hemisphere (cluster-corrected p < 10−8, and gently shaded to show relative amplitude).

