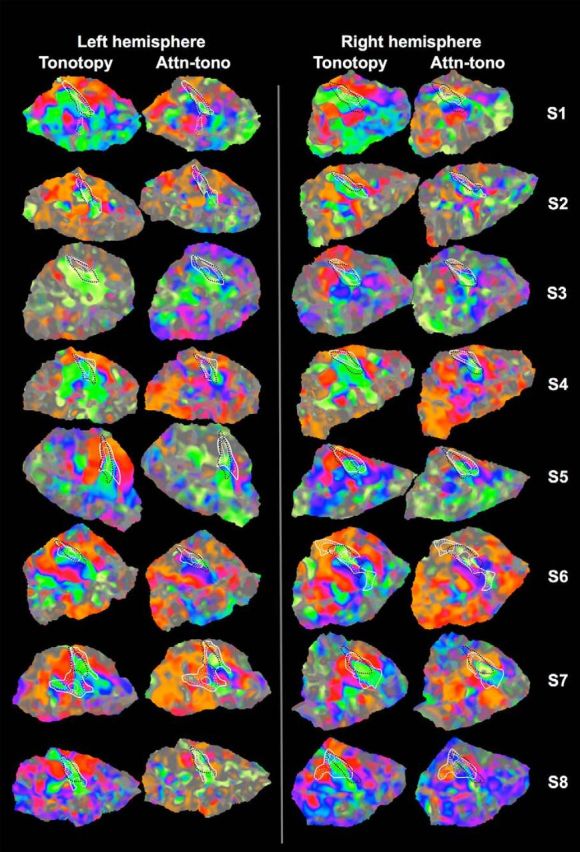
Figure 3.

Individual subjects' tonotopy and attn-tono maps. Each subject's tonotopic and attn-tono (stepped) Fourier analysis-derived maps are displayed on the same subject's flattened superior temporal cortical patch. White represents R1 isocontours around presumptive auditory core. Thick solid lines indicate the lowest valued (outermost) R1 isocontour. Thin solid lines indicate the highest (innermost) R1 isocontour. Dashed lines indicate intermediate values. R1 values differ somewhat across individuals. Dashed black lines indicate the outline of the cortical surface-morphed TE1.0 label, where the area inside the line contains vertices estimated to have a p > 0.3 probability of falling within primary auditory cortex based on the Morosan et al. (2001) postmortem probability atlas (see Materials and Methods). Activation maps are gently shaded to show changes in response amplitude but are unthresholded for comparison with individual maps from previous studies (e.g., Da Costa et al., 2011).
