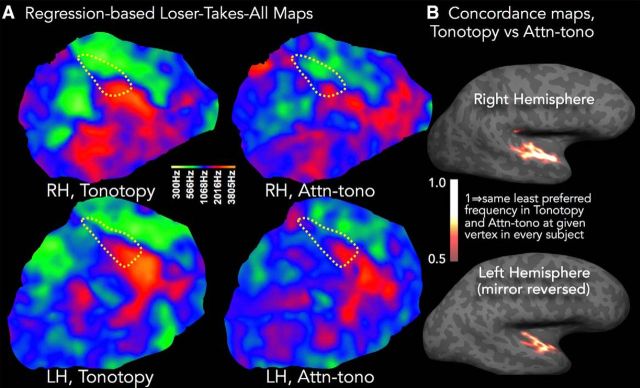
Figure 6.
Comparison of responses in regression-based LTA maps, tonotopy, and attn-tono. A, The colormaps projected onto the same cortical patches as in Figures 2 and 4 show cross-subject group-average maps that depict the frequency band that drives the least activation compared with all other frequency bands (LTA) in tonotopy and attn-tono (stepped plus randomized blocks) conditions and in right and left hemispheres. As in Figure 4, the presumptive auditory core shown by the dashed yellow line depicting the outermost R1 contour (0.66 s−1). B, The tonotopy versus attn-tono LTA concordance map was created as in Figure 5A. The midpoint of the heatscale has been lowered slightly compared with Figure 5A, reflecting the overall somewhat lower concordance in the LTA maps compared with WTA. Dotted yellow R1 isocontour is the same as in Figure 4.

