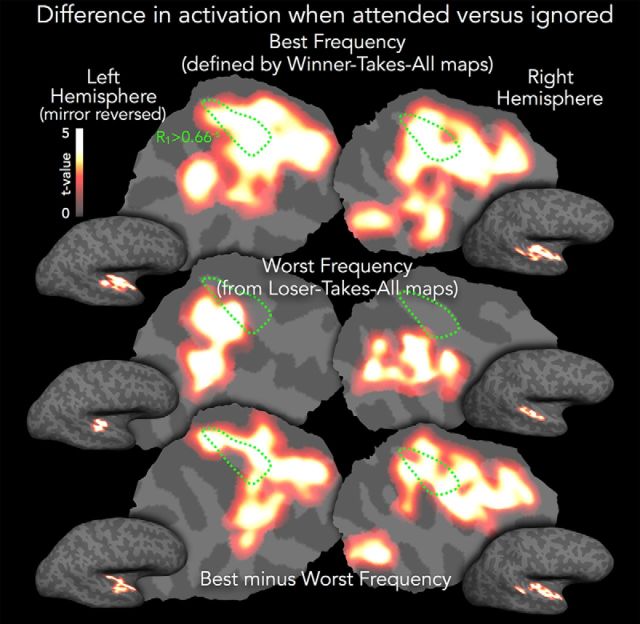
Figure 7.
Comparison of maps when best frequency is attended versus ignored. The heatscale (t values, thresholded as in Fig. 5A) depicts the cross-subject cortical surface-based average difference in activation when the subject-specific best frequency band of each voxel was attended versus ignored. The dotted green R1 isocontour estimating auditory core is as in Figure 4.

