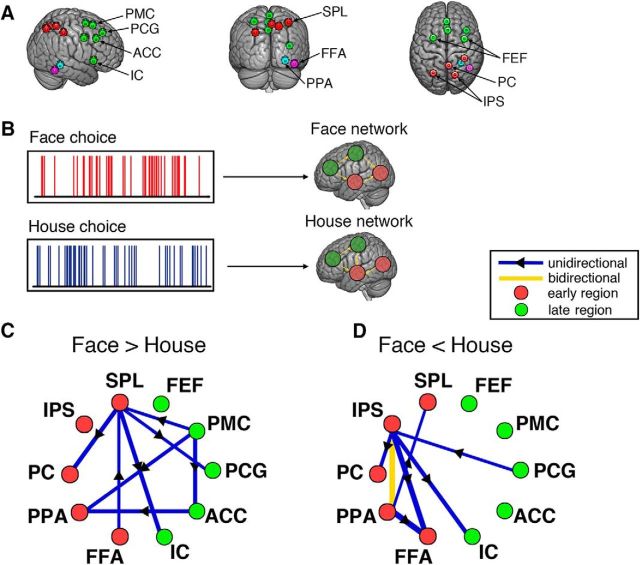
Figure 4.
Causal modeling on choice-modulated networks. A, Illustration of 10 ROIs selected for the causal modeling. Red circles represent nodes in the early subsystem. Green circles represent nodes in the late subsystem. Blue and purple circles represent the PPA and FFA of a representative subject, included as part of the early subsystem. B, Scheme of the causal modeling using the MDS model for choice-modulated network analysis. MDS estimates the connectivity between nodes in the networks elicited by face choices and house choices, respectively. The connectivity pattern reflects the modulatory effect of a specific experimental condition on the network. C, Mean difference in causal connections between face network and house network (Face>House), averaged across subjects. D, Mean difference in causal connections between face network and house network (Face<House). The significance threshold for each connection at p < 0.001 was determined by a nonparametric permutation test with FDR correction for multiple comparisons. All network connections shown in C and D passed the significant test and their line width indicates the magnitude of the connection strength.

