
Figure 3. Optogenetic Stimulation of mPFC→NAc Projections Does Not Suppress Reward Seeking.
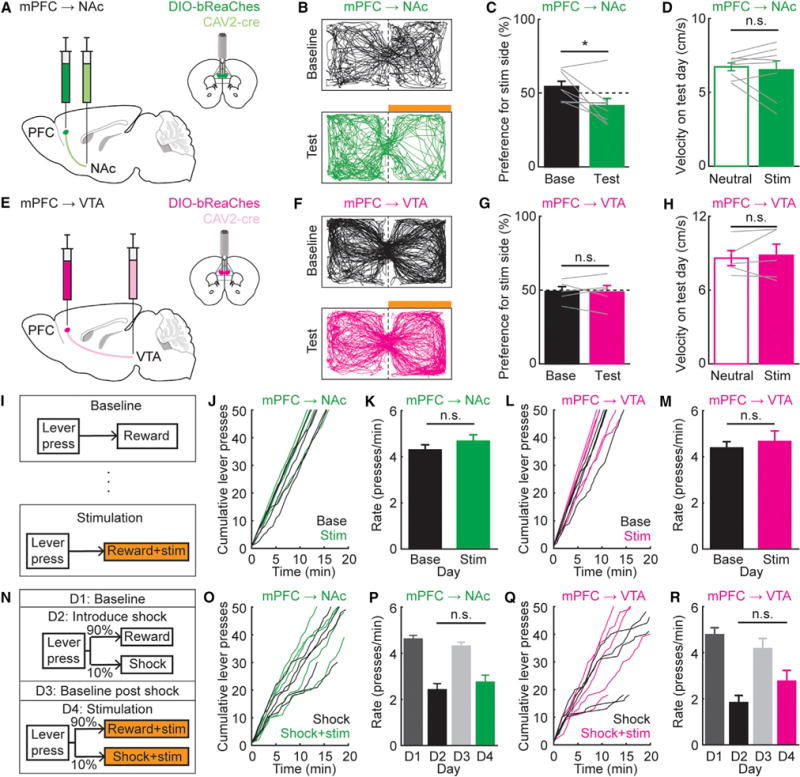
(A) Schematic for mPFC→NAc stimulation.
(B) Example RTPP locomotor traces during baseline and test days: mPFC→NAc mice. Orange bar, stimulation side.
(C) % time spent on stimulation side (stim): baseline (base) and test days. mPFC→NAc mice spent less time on the stim side (test versus baseline days; n = 8 mice; paired t test, t7 = 2.67, *p = 0.032). Grey lines, individual mice.
(D) No change in velocity on test day (neutral versus stim side, mPFC→NAc; n = 8 mice; paired t test, t7 = 0.50, p = 0.63).
(E–H) As in (A)–(D), for mPFC→VTA. No difference between % time spent on stim side (baseline versus test day; n = 5 mice; paired t test, t4 = 0.17, p = 0.87). No change in velocity on test day (neutral versus stim side; n = 5 mice; paired t test, t4 = −0.48, p = 0.66).
(I) Protocol: on baseline and stim days, 100% of lever presses gave liquid reward. On stim day, each press also resulted in 5 s bReaChES stimulation.
(J) Cumulative # lever presses, baseline and stim sessions, mPFC→NAc mice. Each line: individual mouse.
(K) Average rate of pressing, baseline and stim days, mPFC→NAc mice. No difference in rate of pressing on baseline versus stim days (n = 5 mice; paired t test, t4 = −1.28, p = 0.27).
(L and M) As in (J) and (K), except mPFC→VTA mice. No difference in press rate, baseline versus stim day (n = 5 mice; paired t test, t4 = −0.80, p = 0.47).
(N) Protocol. Days 1 and 3: 100% of presses gave liquid reward. Days 2 and 4: 10% of presses gave 1 s foot shock instead. Day 4: each press also resulted in 5 s bReaChES stimulation.
(O) Cumulative # of presses: day 2 (shock), day 4 (shock + stim), mPFC→NAc mice.
(P) Average rate of pressing across days, mPFC→NAc. No difference, day 2 (shock) versus day 4 (shock + stim; n = 5 mice; one-way ANOVA, F3,16 = 28.59, p = 1.16e–6; Tukey-Kramer multiple comparisons test, day 2 versus day 4, p = 0.69).
(Q and R) As in (O) and (P), for mPFC→VTA. No difference in pressing, day 2 versus day 4 (n = 5 mice; one-way ANOVA, F3,16 = 13.76, p = 1.07e–4; Tukey-Kramer multiple comparisons test, day 2 versus day 4, p = 0.30).
All bar graphs plotted as mean ± SEM.