
Figure 4. mPFC→NAc and mPFC→VTA Population Dynamics Can Discriminate Reward and Shock Trials.
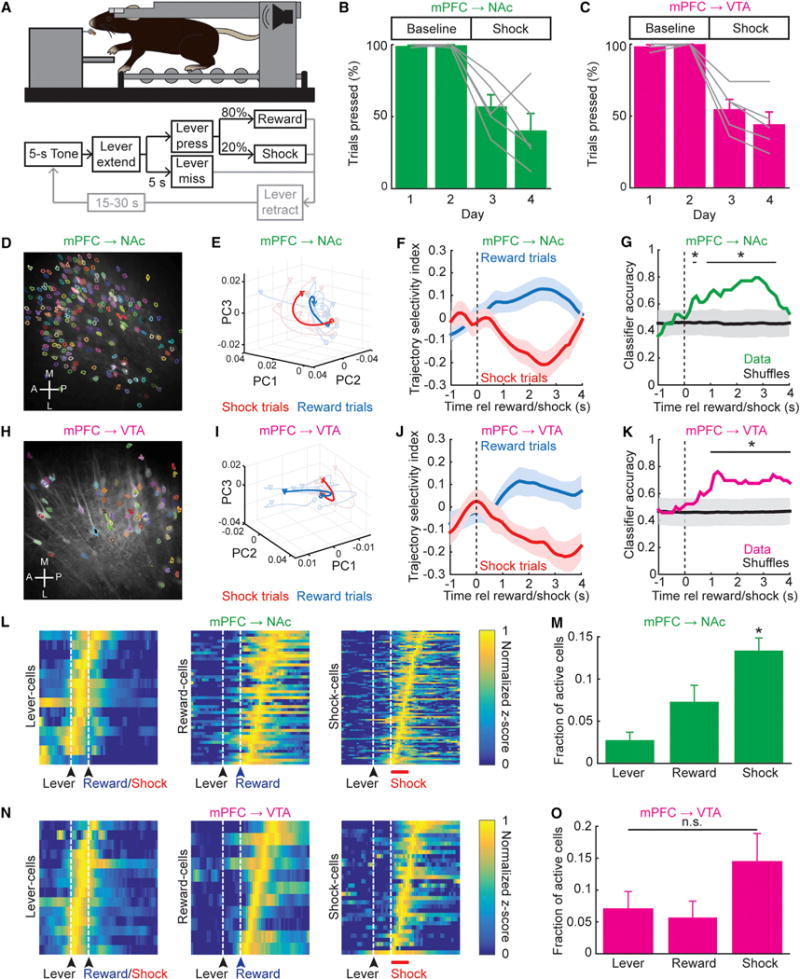
(A) Schematic. After 5 s tone, lever extended for 5 s; lever press gave 80% chance of reward/20% chance of 1 s foot-shock. 1 s delay between lever press and reward/shock. If no press in 5 s, lever retracted.
(B and C) % press trials (two baseline and two shock days, 50 trials/day). mPFC→NAc (B) and mPFC→VTA (C) mice suppressed pressing during shock days versus baseline days (mPFC→NAc: n = 5 mice; one-way ANOVA, F3,16 = 17.66, p = 2.49e–5; Tukey-Kramer multiple comparisons test, p < 0.05, shock versus baseline days. mPFC→VTA: n = 5 mice; one-way ANOVA, F3,16 = 28.58, p = 1.13e–5; Tukey-Kramer multiple comparisons test, p < 0.05, shock versus baseline days).
(D) Example 2-photon image, GCaMP6f in mPFC→NAc neurons. Active cells outlined as masks.
(E) Example reward/shock trial trajectories projected onto first 3 PC dimensions; single mPFC→NAc mouse. Thin lines, individual trials; thick lines, mean.
(F) Averaged trajectory-selectivity index across reward/shock trials (all mice) calculated as (dshock – dreward)/(dshock + dreward) where d = Euclidean distance of trial to either mean reward or shock trajectory. Mean ± SEM (n = 22 reward/22 shock trials; 5 mice).
(G) Classifier accuracy for all trials across mice; trajectory selectivity indices discriminated reward/shock trials (1,000 shuffled distributions plotted as mean ± 2 SD; *p < 0.05).
(H–K) As in (D)–(G), for mPFC→VTA cells. Reward/shock trials could be discriminated using trajectory-selectivity indices (n = 23 reward/23 shock trials; 5 mice).
(L) Heatmaps of normalized z-scored activity for mPFC→NAc cells correlated with lever press, reward, or shock.
(M) Mean fractions mPFC→NAc lever cells, reward cells, and shock cells (more shock cells seen than lever or reward cells; n = 5 mice; one-way ANOVA, F2,12 = 12.25, p = 0.0013; Tukey-Kramer multiple comparisons test *p < 0.05).
(N and O) As in (L) and (M), for mPFC→VTA cells. No difference in fraction of lever, reward, or shock cells (n = 5 mice; one-way ANOVA, F2,12 = 1.97, p = 0.18).
All bar graphs plotted as mean ± SEM. See also Figures S4 and S5.