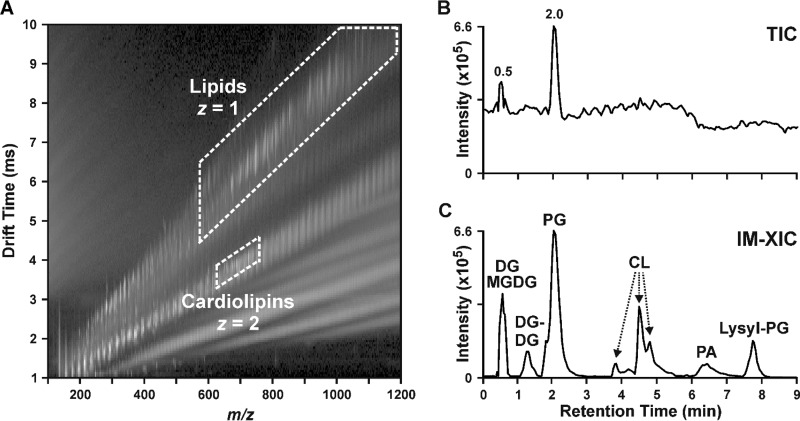
FIG 1 .
Lipidomics analysis by HILIC-IM-MS. (A) 2D plot of IM drift time versus m/z shows that singly charged (z = 1) lipids occupy a region distinct from that of doubly charge (z = 2) lipids such as CLs. (B) The TIC (0 to 9 min of a 12-min run) from the negative-mode analysis of a lipid mixture suffers from high baseline noise. (C) Extraction of the regions containing z = 1 and z = 2 lipids (dashed outlines) generated an IM-XIC containing only the lipid signals from the mixture of DGs, MGDGs, DGDGs, PGs, CLs, PAs, and lysyl-PGs.

