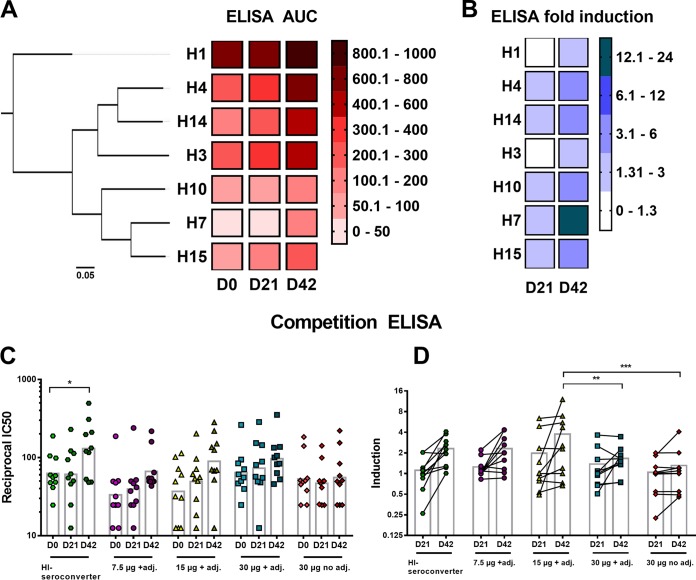
FIG 3 .
Cross-group reactivity. (A) A phylogenetic tree of group 2 HAs is depicted on the left. The scale bar at the bottom shows 5% difference in amino acid identity. Heat map showing the ELISA area under the curve values for H1, H4, H14, H3, H10, H7, and H15 for time points day 0 (D0), day 21 (D21), and day 42 (D42) postvaccination. The color key (AUC values of 0 to 1,000) is shown on the right. For analysis, all treatment groups (n = 35 per group) were combined. (B) Heat map representing the fold induction based on absolute ELISA values over baseline at time points day 21 (D21) and day 42 (D42) postvaccination for all group 2 HAs and group 1 HA H1 (Cal09). The color key is shown (fold induction of 0 to 24) on the right. The four different treatment groups were combined for analysis (n = 35 per group). (C) Reciprocal IC50 values for the five different groups as measured in an H3/stalk mAb competition ELISA are shown for time points day 0, day 21, and day 42. The bars represent the geometric mean values. Time points day 0, day 21, and day 42 were compared to each other within a treatment group in a one-way ANOVA. (D) Induction of reciprocal IC50 values for day 21 and day 42 serum samples over baseline (day 0). The bars show the GM values. Statistical significance was analyzed for each day 21 time point compared to every other day 21 time point. The same procedure was applied for time point day 42. Significance is indicated as follows: no symbol, P > 0.05; *, P ≤ 0.05; **, P ≤ 0.01; ***, P ≤ 0.001; ****, P ≤ 0.0001. adj., adjuvant.

