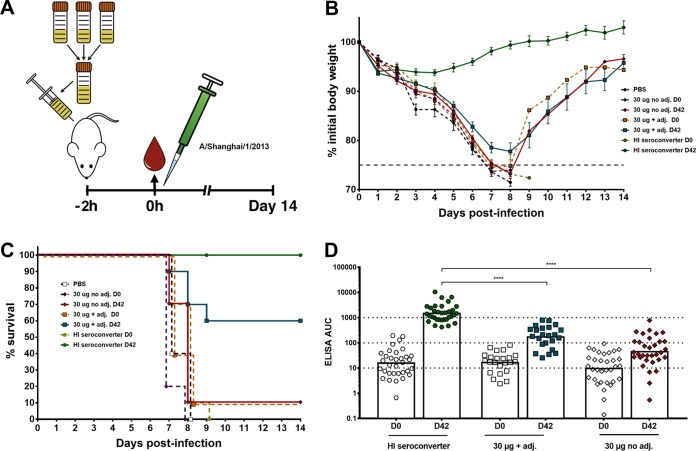
FIG 5 .
In vivo protectivity of human serum antibodies in a lethal mouse challenge model. (A) Graphic representation of the serum transfer and lethal challenge animal experiment. Sera from all individuals of a selected group were pooled and given to female BALB/c mice (n = 10 per group). After 2 h, the mice were infected intranasally with 5 50% lethal doses (2 × 10⁴ PFU) of H7N9 virus (A/Shanghai/1/13, PR8-based 6:2 reassortant). Weight loss and survival were monitored for 14 days. (B) The weight loss curve of the mouse challenge experiment is shown. The dashed colored lines represent the prevaccination sera. The dashed gray line represents 75% of initial body weight, which was used as the humane endpoint. (C) Survival graph showing percent survival in the different groups used in the animal experiment. The dashed lines represent prevaccination sera. (D) Anti-H7 antibody levels of the groups used in the challenge experiment are shown as ELISA AUC values. The dotted lines at titers of 10, 100, and 1,000 indicate differences of 1 log. Time point day 0 of each group was tested against every other time point day 0 in a one-way ANOVA with a Sidak posttest for multiple comparisons. The same analysis was applied for time point day 42. Significance is indicated as follows: no symbol, P > 0.05; *, P ≤ 0.05; **, P ≤ 0.01; ***, P ≤ 0.001; ****, P ≤ 0.0001. adj., adjuvant.

