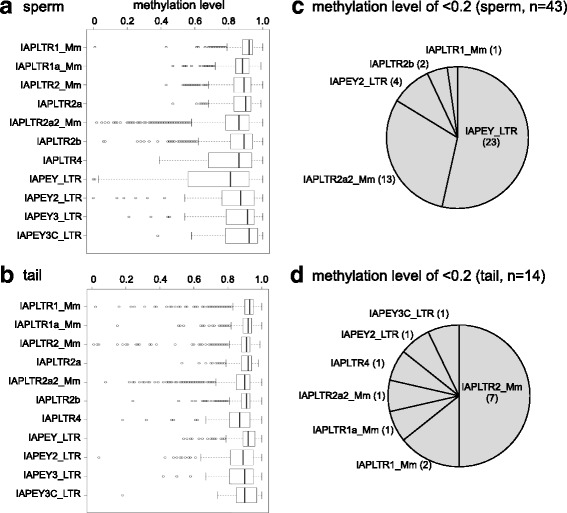
Fig. 4.

Specific subfamilies are enriched in hypomethylated copies. a, b Box plots of DNA methylation levels of IAP subfamilies in the sperm (a) and in the tail (b). c, d Subfamily distributions of hypomethylated copies (methylation level < 0.2) in the sperm (c) and in the tail (d) are shown in pie charts. The numbers in parentheses indicate actual copy numbers
